

New setups
USDZAR-Long Idea

The above weekly chart formed approximately a 4-year-long Cup & Handle chart pattern where the handle part is formed as a 10-month-long ascending triangle chart pattern.
Within this pattern, the horizontal boundary at 19.3479 levels acts as a resistance.
A daily close above 19.54 levels would validate the breakout from both the 4-year-long Cup & Handle and 10-month-long ascending triangle chart patterns.
Based on this chart pattern, the potential price targets are respectively 27.88 and 22.69 levels.
Declining interest rate cut probabilities for May and June are effective in strong dollar pricing. The first ‘ rate cut` is priced to be done in July according to the below implied by the 30-day Fed Funds futures pricing data. (2nd column). You can follow the data from the `CME FED watch tool`.
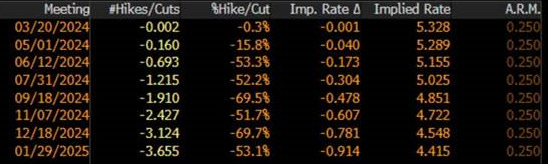
Source: BBG, Date:02/27/2024

AUDJPY-Long Idea
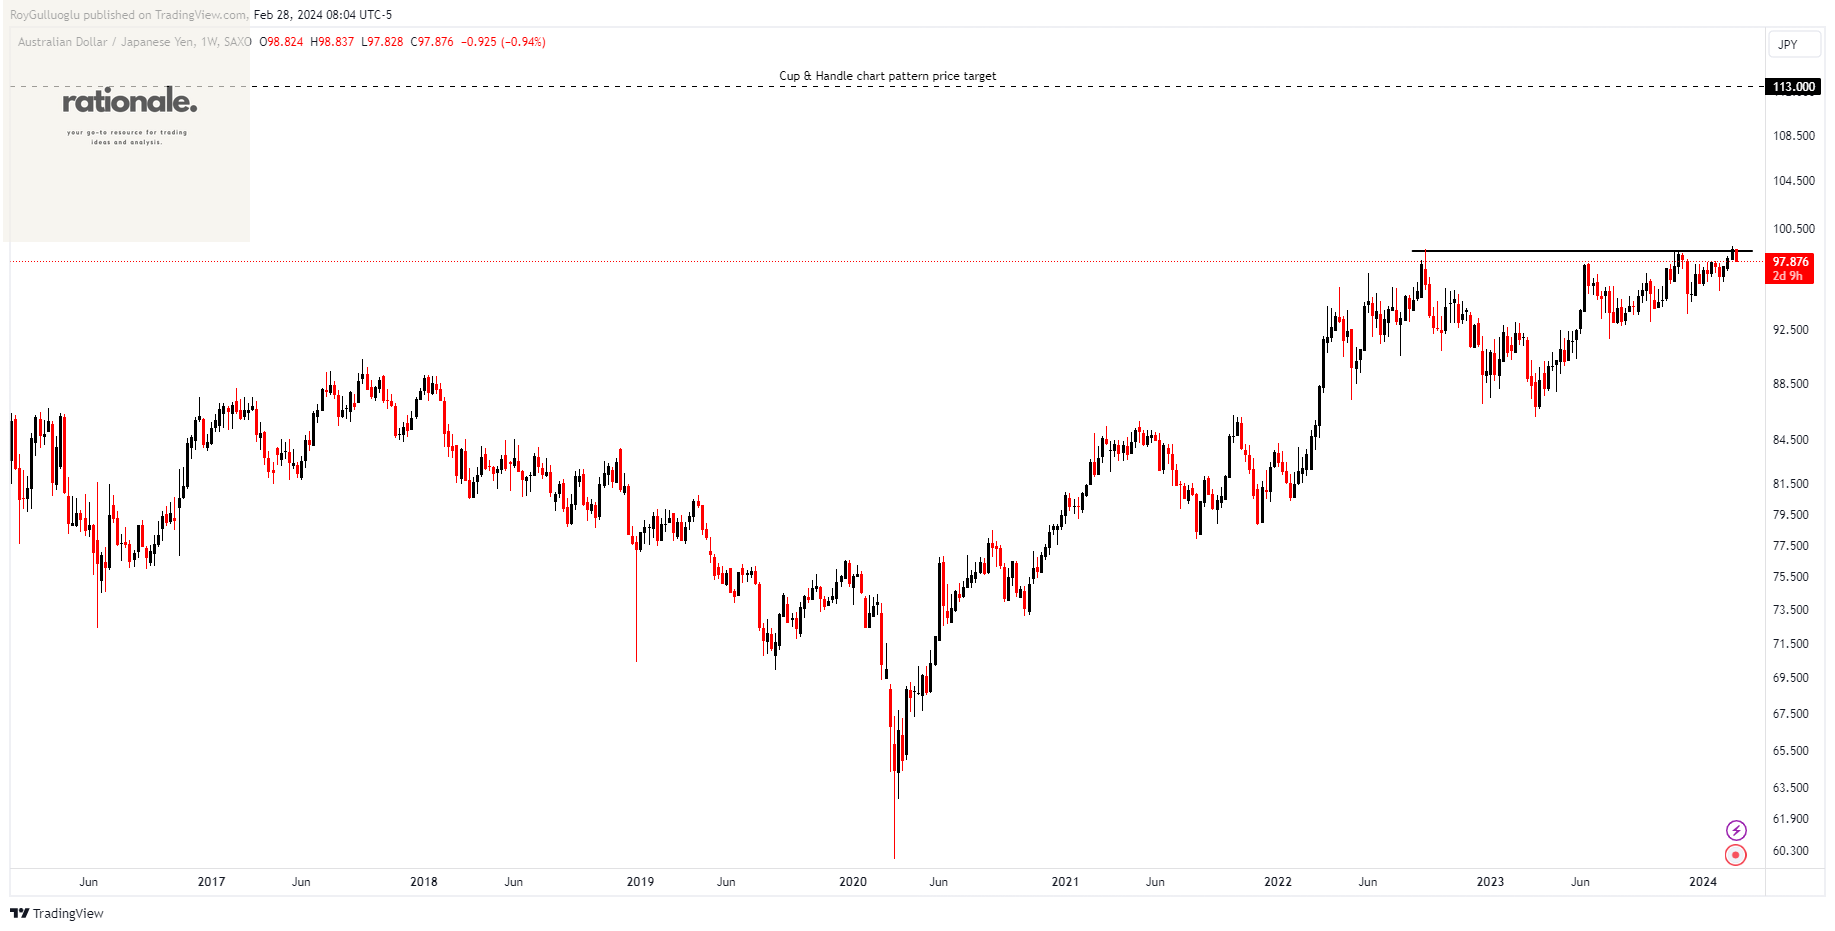
The above weekly chart formed an approximately 20-month-long Cup & Handle chart pattern as a bullish continuation after an uptrend.
Within this pattern, the horizontal boundary at 98.64 levels acts as a support.
A daily close above 99.62 levels would validate the breakout from the 20-month-long Cup & Handle chart pattern.
Based on this chart pattern, the potential price target is 113 levels.
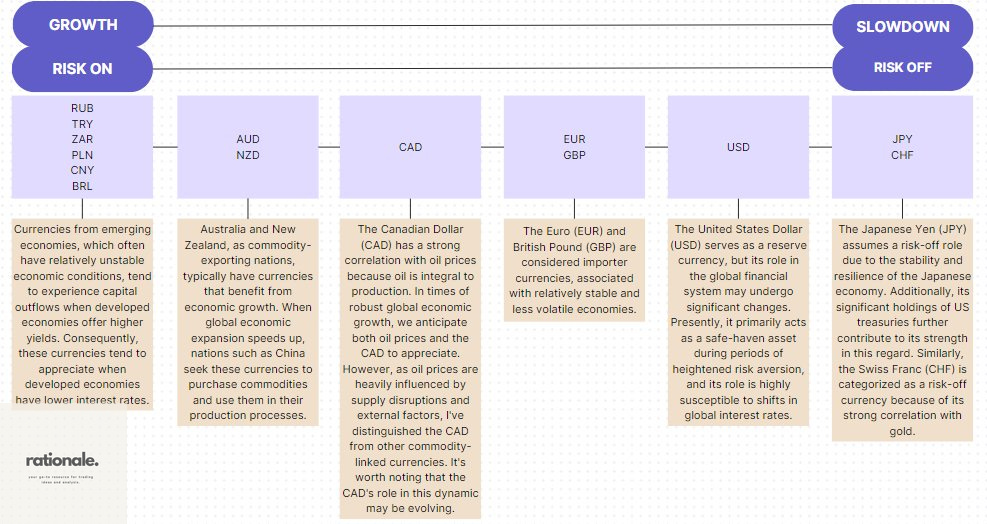
AUDJPY long bet stands for
High economic growth - Why? - During the economic expansion, demand for commodities increases. Considering the commodity exporter role of Australia, we would expect the currency to increase.
Being `Risk-On`

What is the potential risk of this trade idea?
Carry - Potential pricing of the hawkish shift of BoJ (presumably after March 2024) and the upcoming rate cut schedule of the RBA.
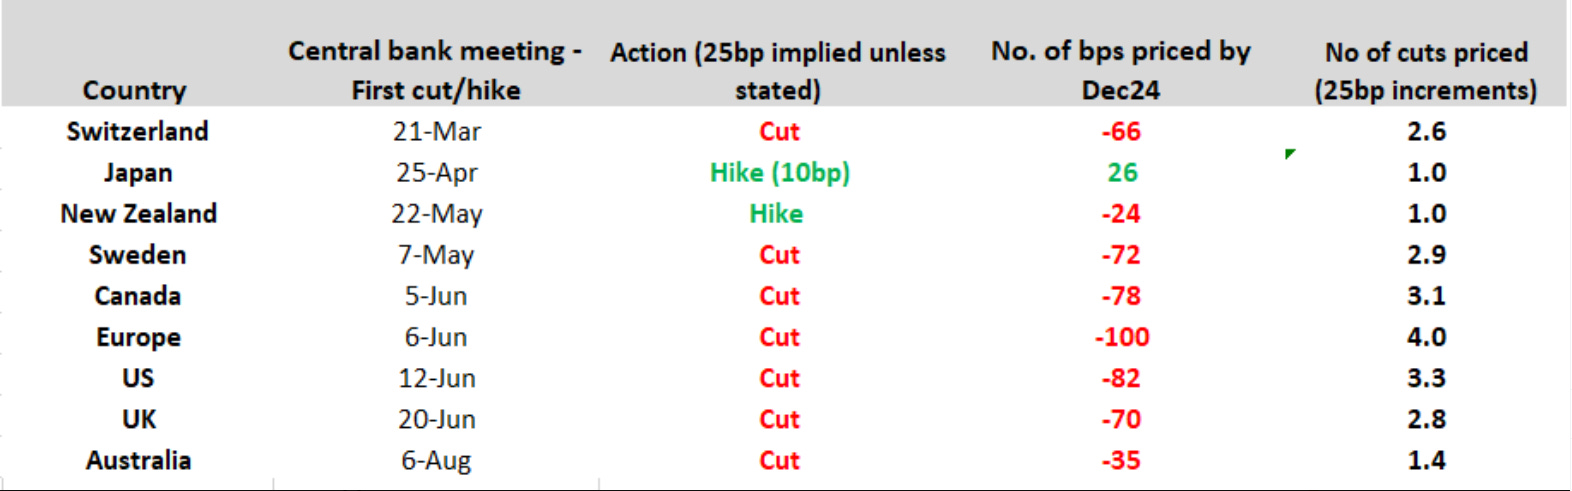
Source: Chris Weston-Twitter(X)

CL1!(Crude Oil Futures)-Long Idea
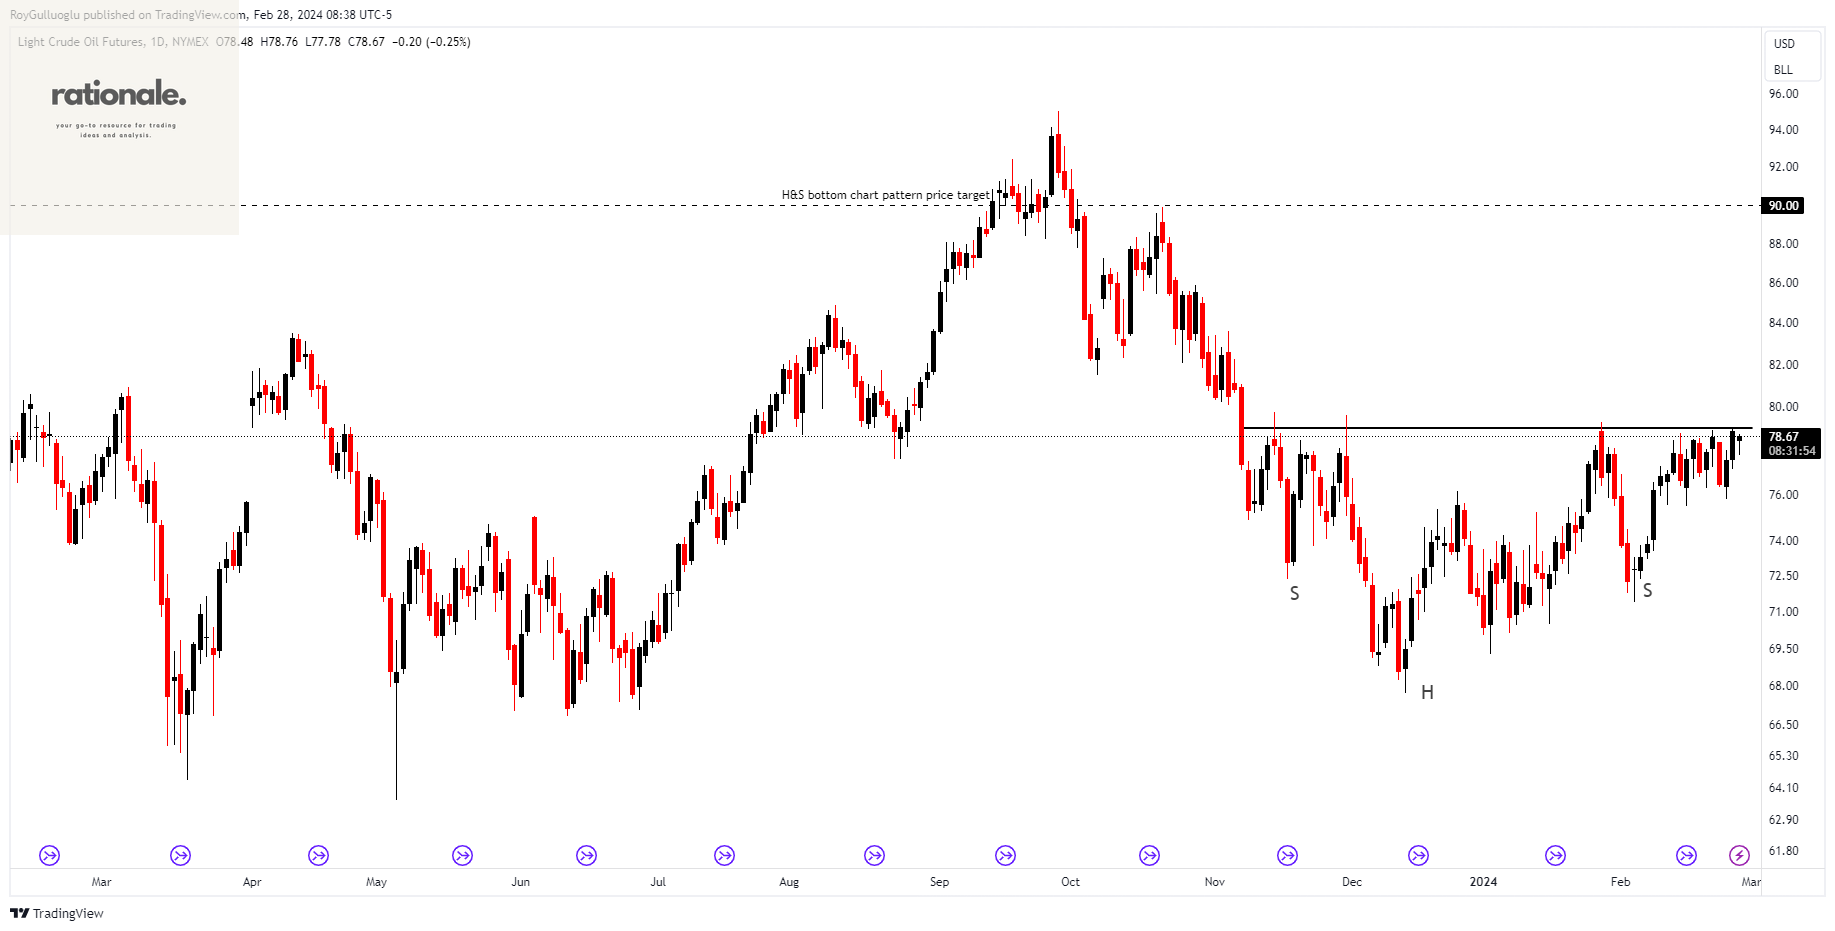
The above daily chart formed an approximately 3-month-long H&S bottom chart pattern as a bullish reversal after a downtrend.
Within this pattern, the horizontal boundary at 79 levels acts as a resistance.
A daily close above 80.18 levels would validate the breakout from the 3-month-long H&S bottom chart pattern.
Based on this chart pattern, the potential price target is 90 levels.
ARK Innovation ETF-(ARKK/ARCA)-Long Idea
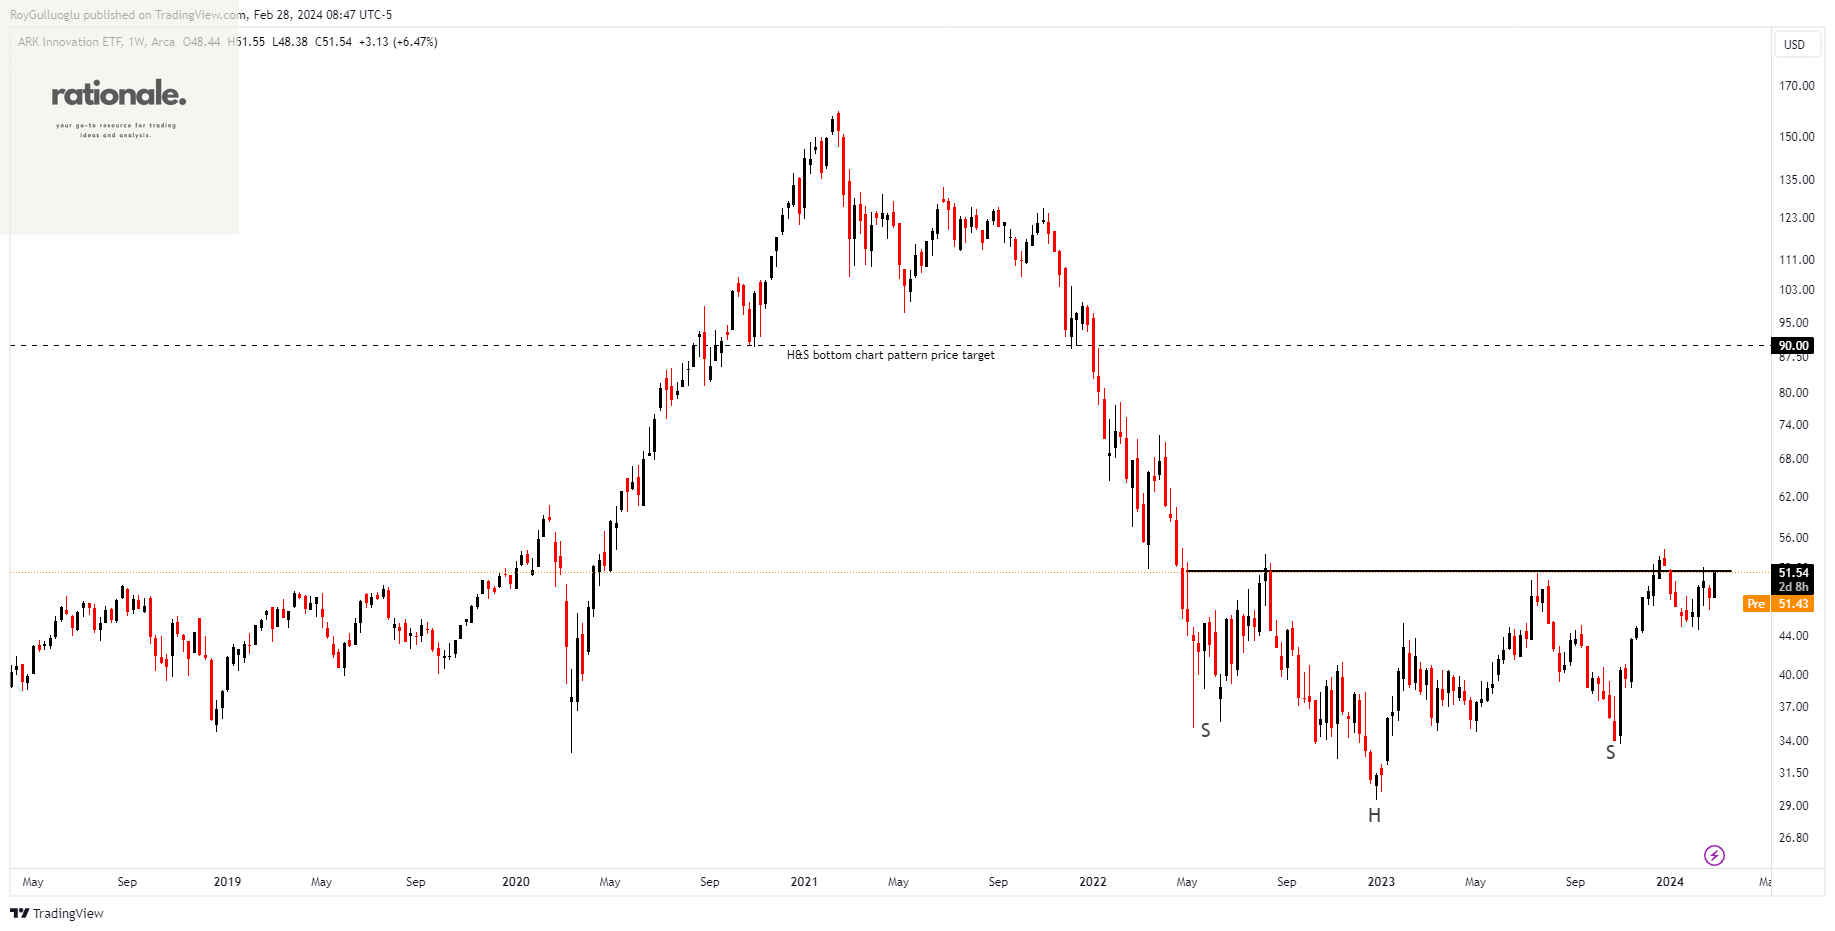
ARKK is a fund that actively manages investments in global companies benefiting from or involved in disruptive innovation, aiming for long-term growth.
The above weekly chart formed an approximately 25-month-long H&S bottom chart pattern as a bullish reversal after a downtrend.
Within this pattern, the horizontal boundary at 52 levels acts as a resistance.
A daily close above 53.56 levels would validate the breakout from the 25-month-long H&S bottom chart pattern.
Based on this chart pattern, the potential price target is 90 levels.
Top 10 holdings

Materials Select Sector SPDR-(XLB/ARCA)-Long Idea
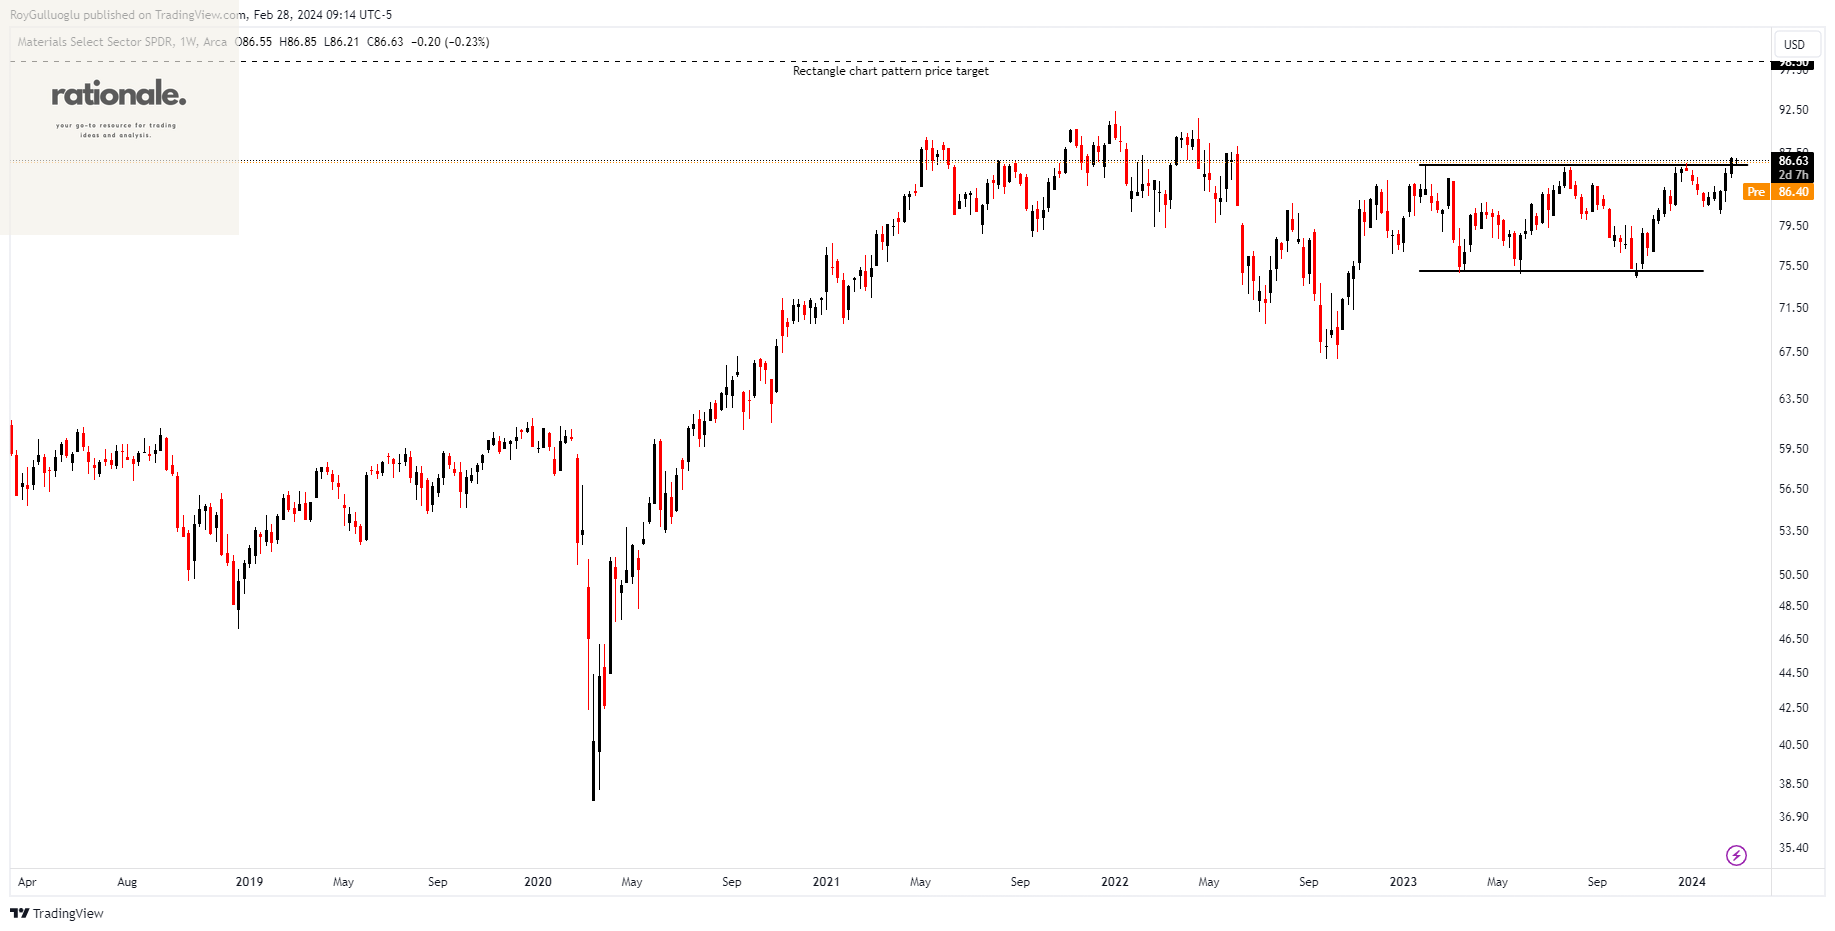
XLB follows an index where US basic materials companies are weighted based on market capitalization. The fund specifically comprises the materials components from the S&P 500.
The above weekly chart formed an approximately 14-month-long rectangle chart pattern as a bullish reversal after a downtrend.
Within this pattern, the horizontal boundary at 86 levels acts as a resistance.
A daily close above 88.5 levels would validate the breakout from the 14-month-long rectangle chart pattern.
Based on this chart pattern, the potential price target is 98.5 levels.
Top 10 holdings
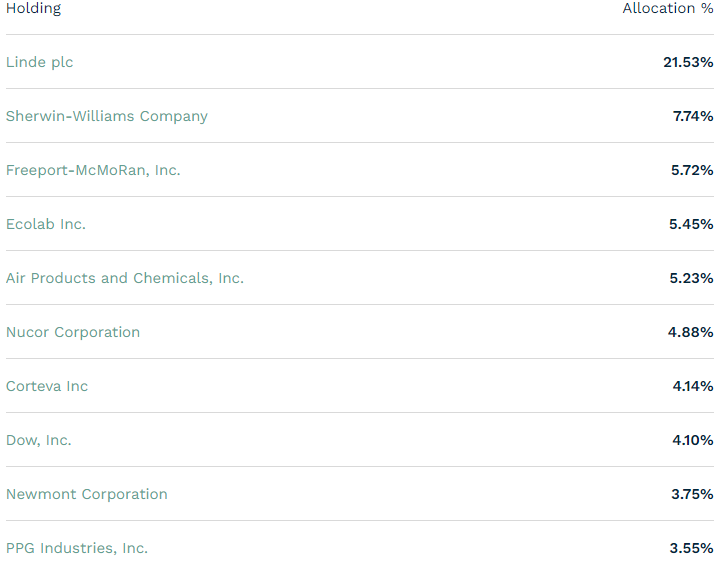
Source: etf.com

FTMUSDT-Long Idea
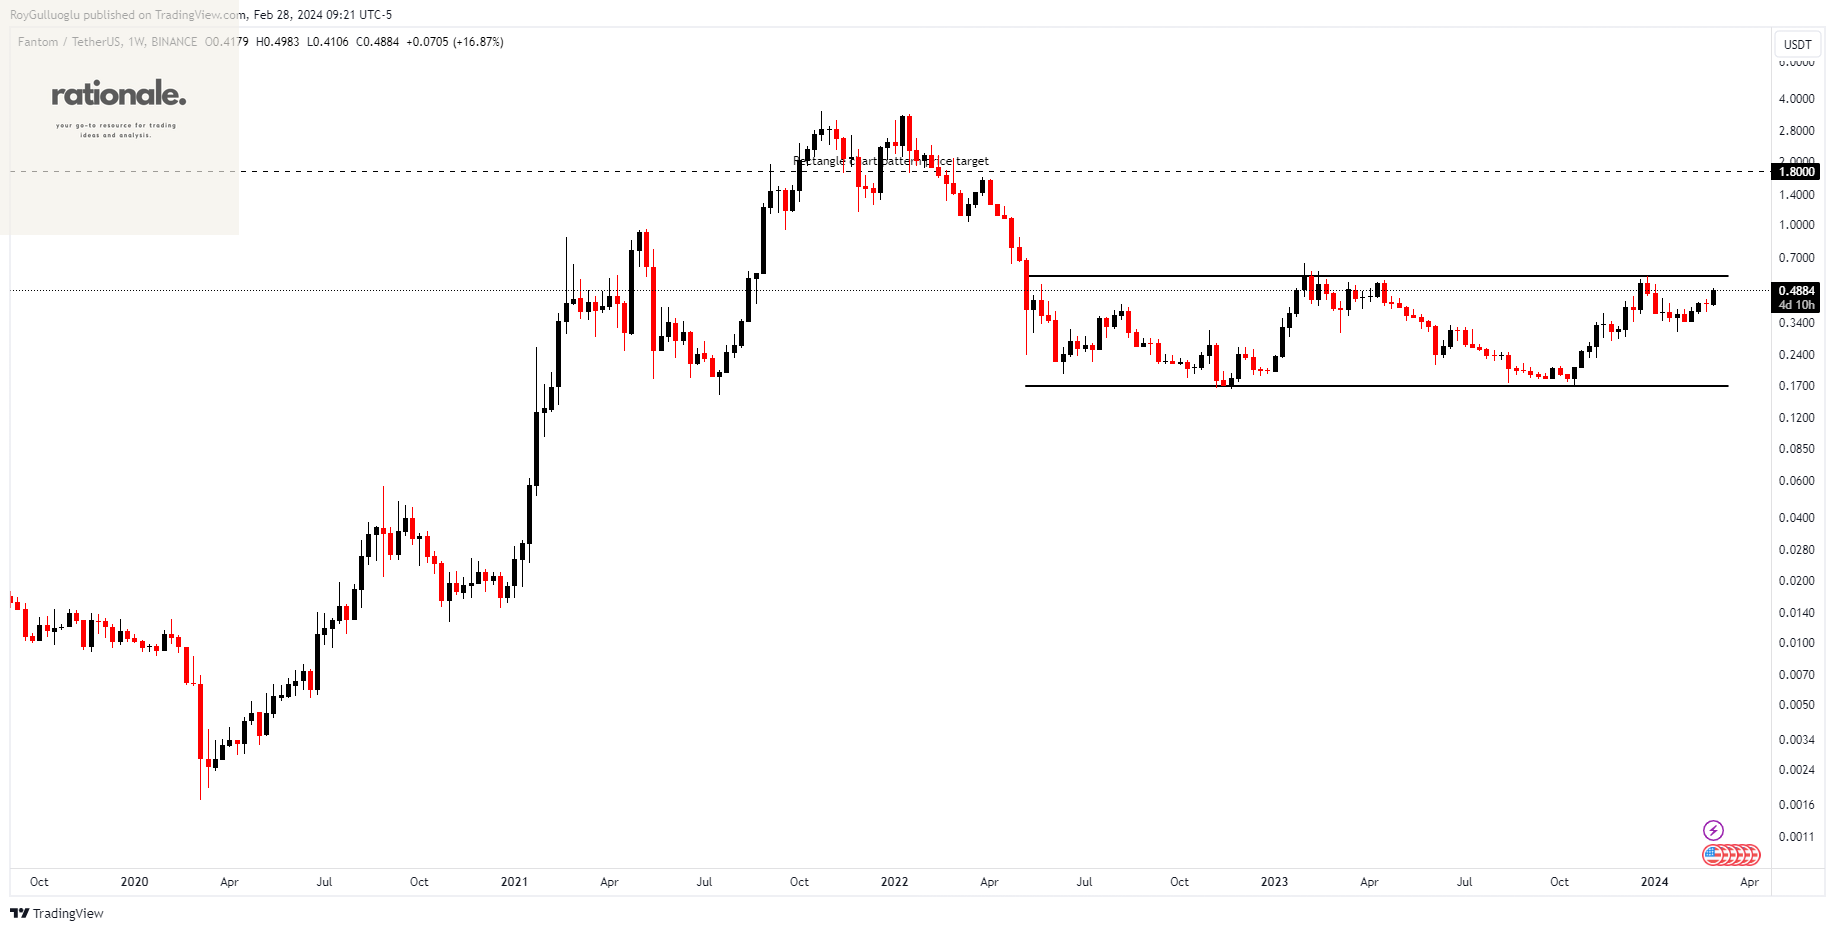
The above weekly chart formed an approximately 17-month-long rectangle chart pattern as a bullish reversal after a downtrend.
The horizontal boundary at 0.57 levels acts as a resistance within this pattern.
A daily close above 0.587 levels would validate the breakout from the 17-month-long rectangle chart pattern.
Based on this chart pattern, the potential price target is 1.8 levels.
SOLUSDT-Long Idea
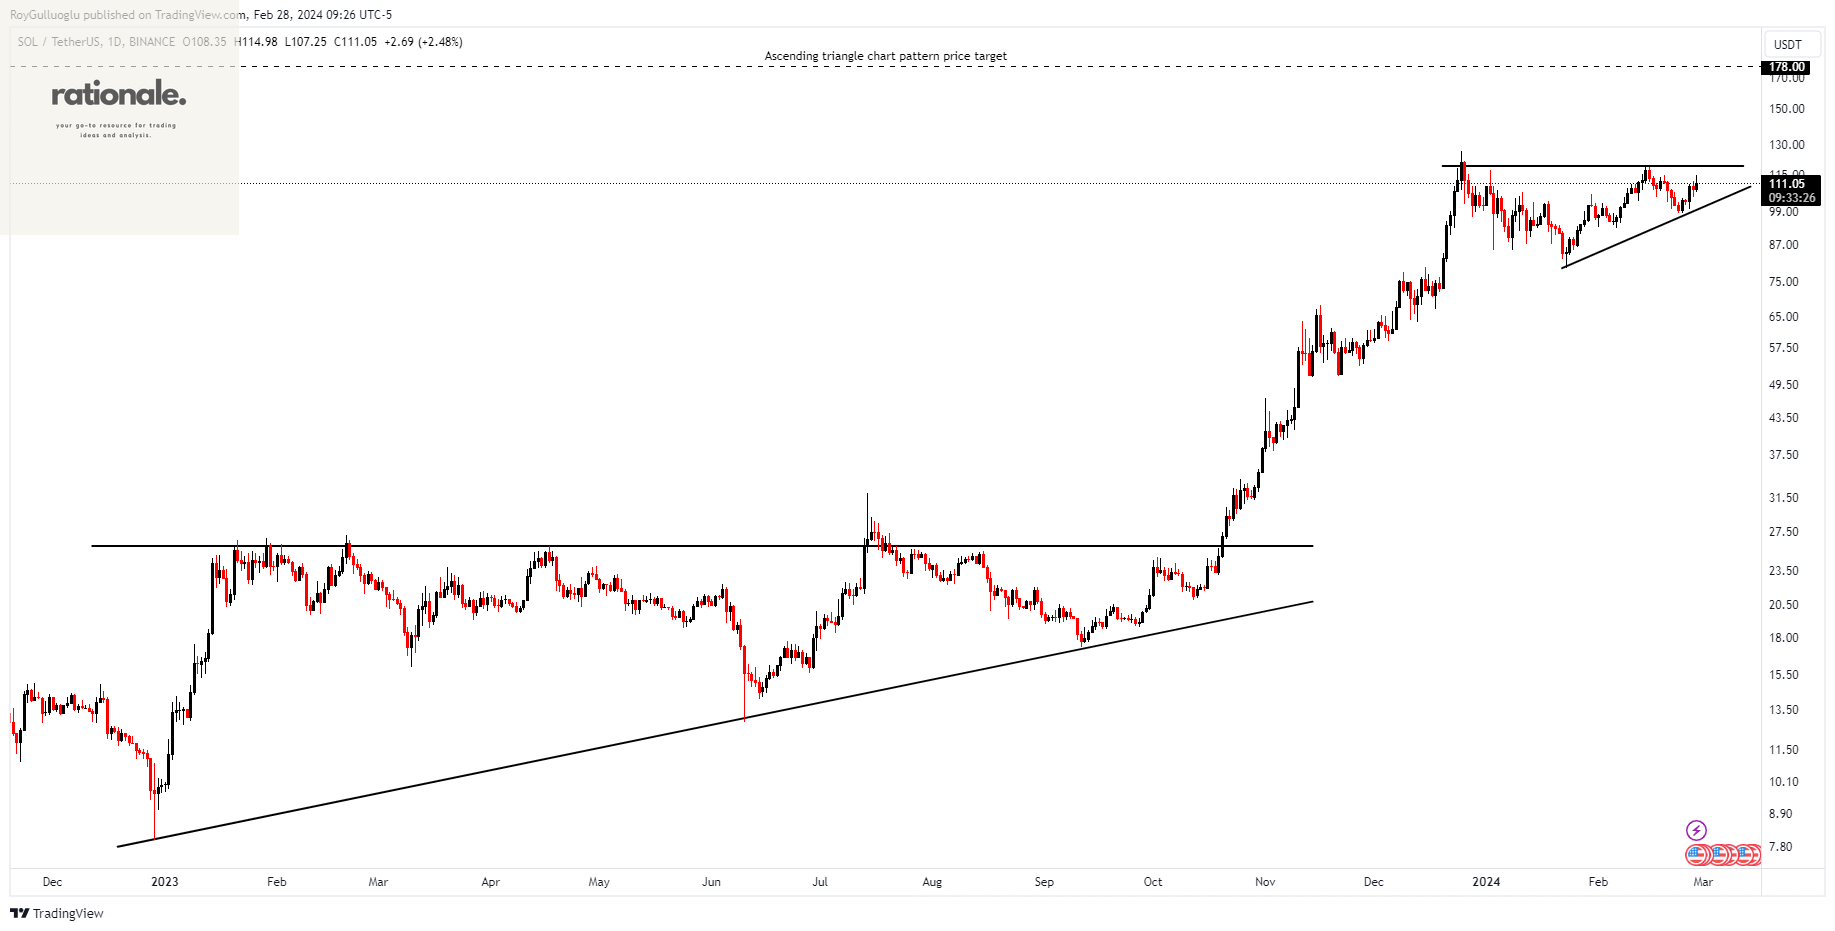
The above daily chart formed an approximately 2-month-long ascending triangle chart pattern as a bullish continuation after an uptrend.
The horizontal boundary at 119.2 levels acts as a resistance within this pattern.
A daily close above 122.7 levels would validate the breakout from the 2-month-long ascending triangle chart pattern.
Based on this chart pattern, the potential price target is 178 levels.
CELOUSDT-Long Idea
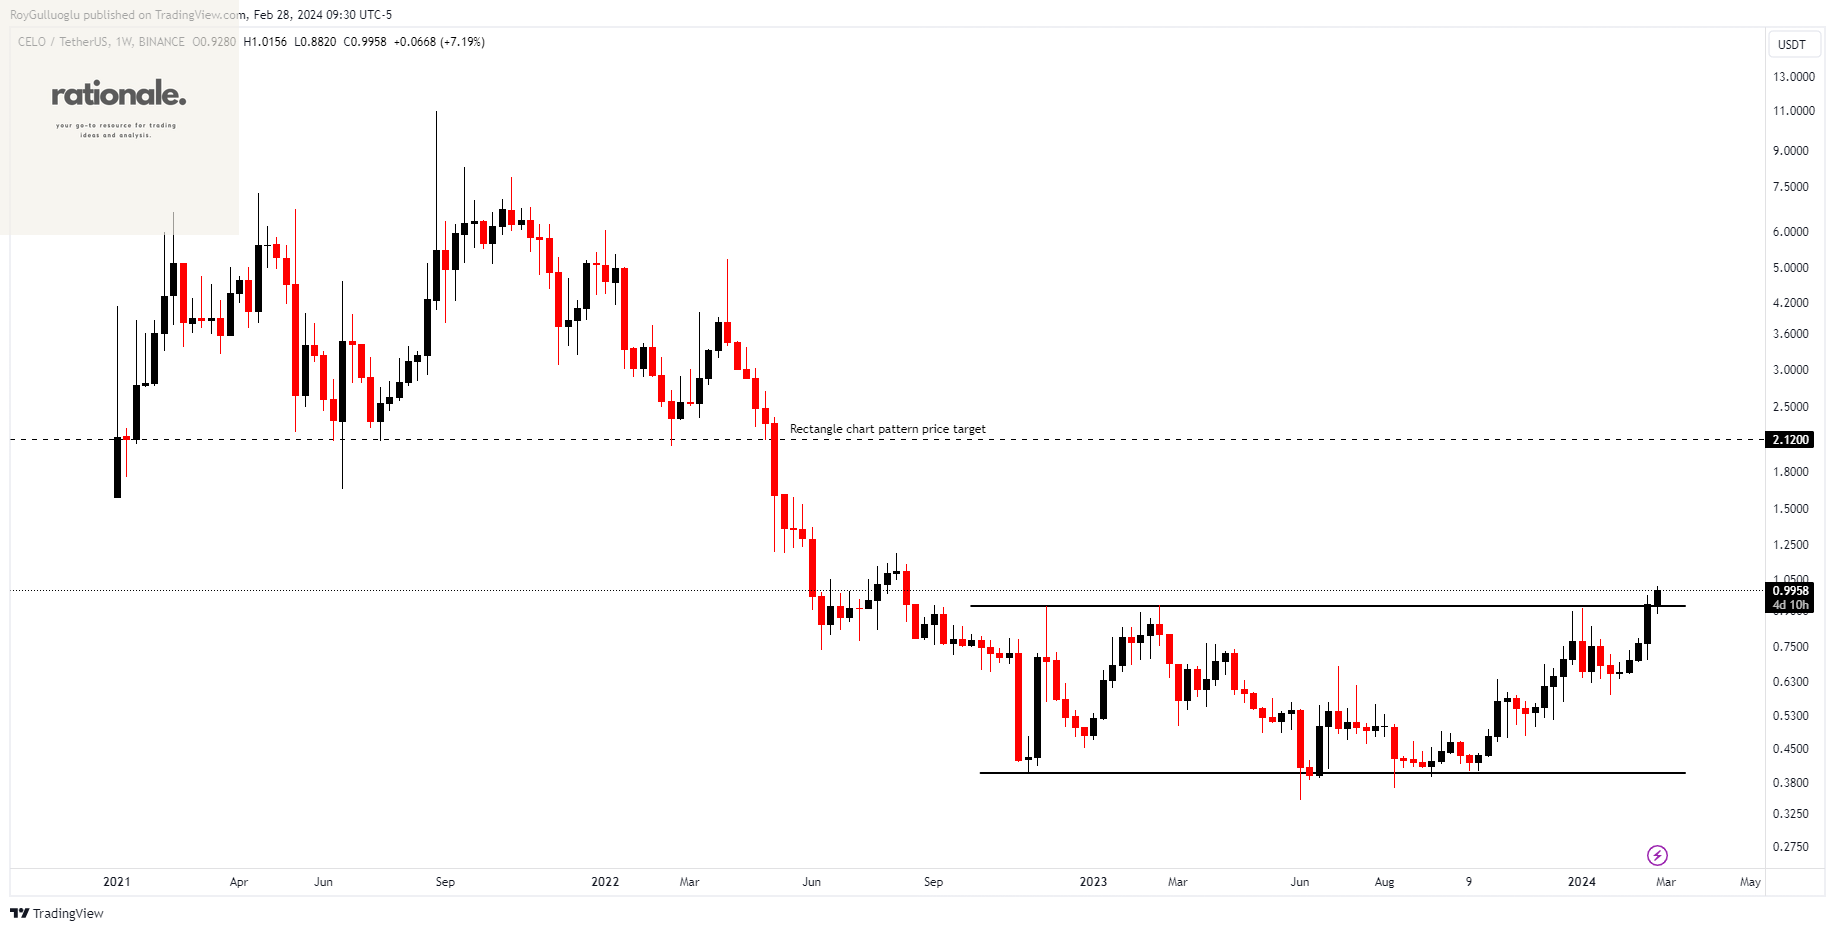
The above weekly chart formed an approximately 15-month-long ascending triangle chart pattern as a bullish continuation after an uptrend.
The horizontal boundary at 0.9185 levels acts as a resistance within this pattern.
A daily close above 0.95 levels would validate the breakout from the 15-month-long ascending triangle chart pattern.
Based on this chart pattern, the potential price target is 2.12 levels.