

Trade Ideas Fx-Futures-Etf-Crypto
NQ1!(CME), CT1!(ICEUS), ZW1!(ICEUS), DXY

NQ1!(Nasdaq 100 Futures)-Short Idea
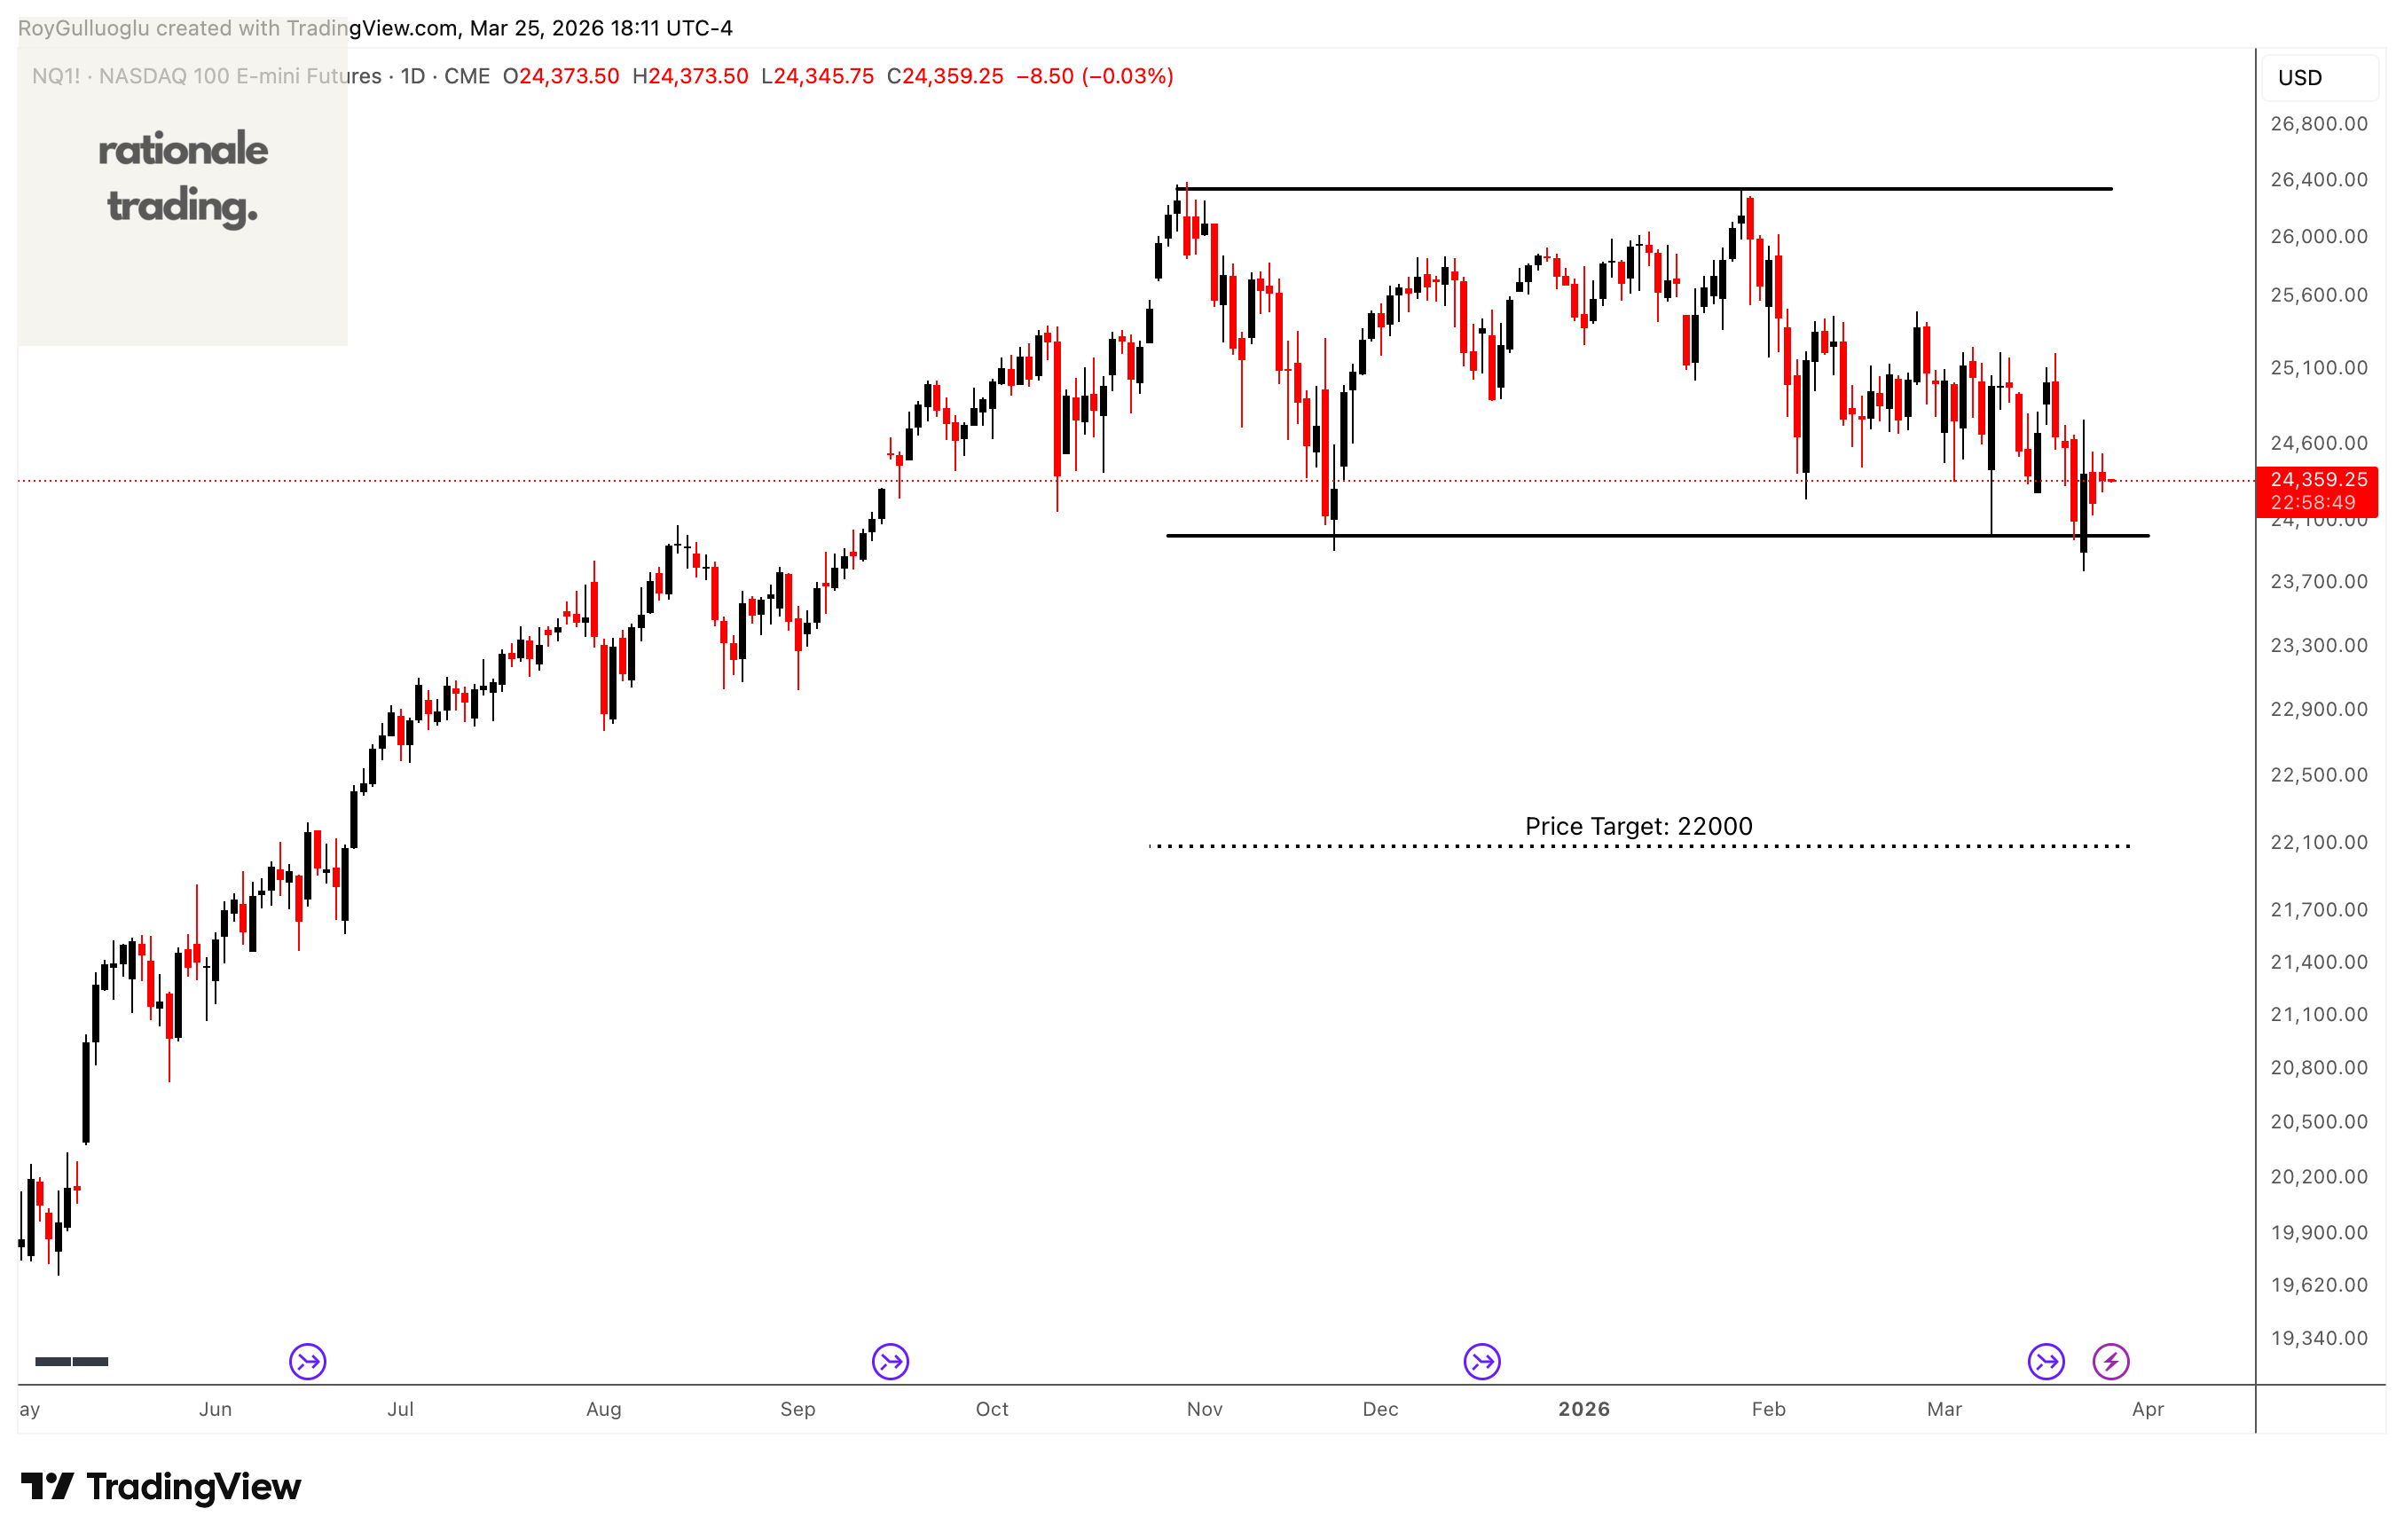
The above daily chart formed an approximately 3-month-long rectangle chart pattern as a bearish reversal after an uptrend.
The horizontal boundary at 24000 levels acts as a support within this pattern.
A daily close below 23760 levels would validate the breakout from the 3-month-long rectangle chart pattern.
Based on this chart pattern, the potential price target is approximately 22000 levels.
CT1!(Cotton No 2 Futures)-Long Idea
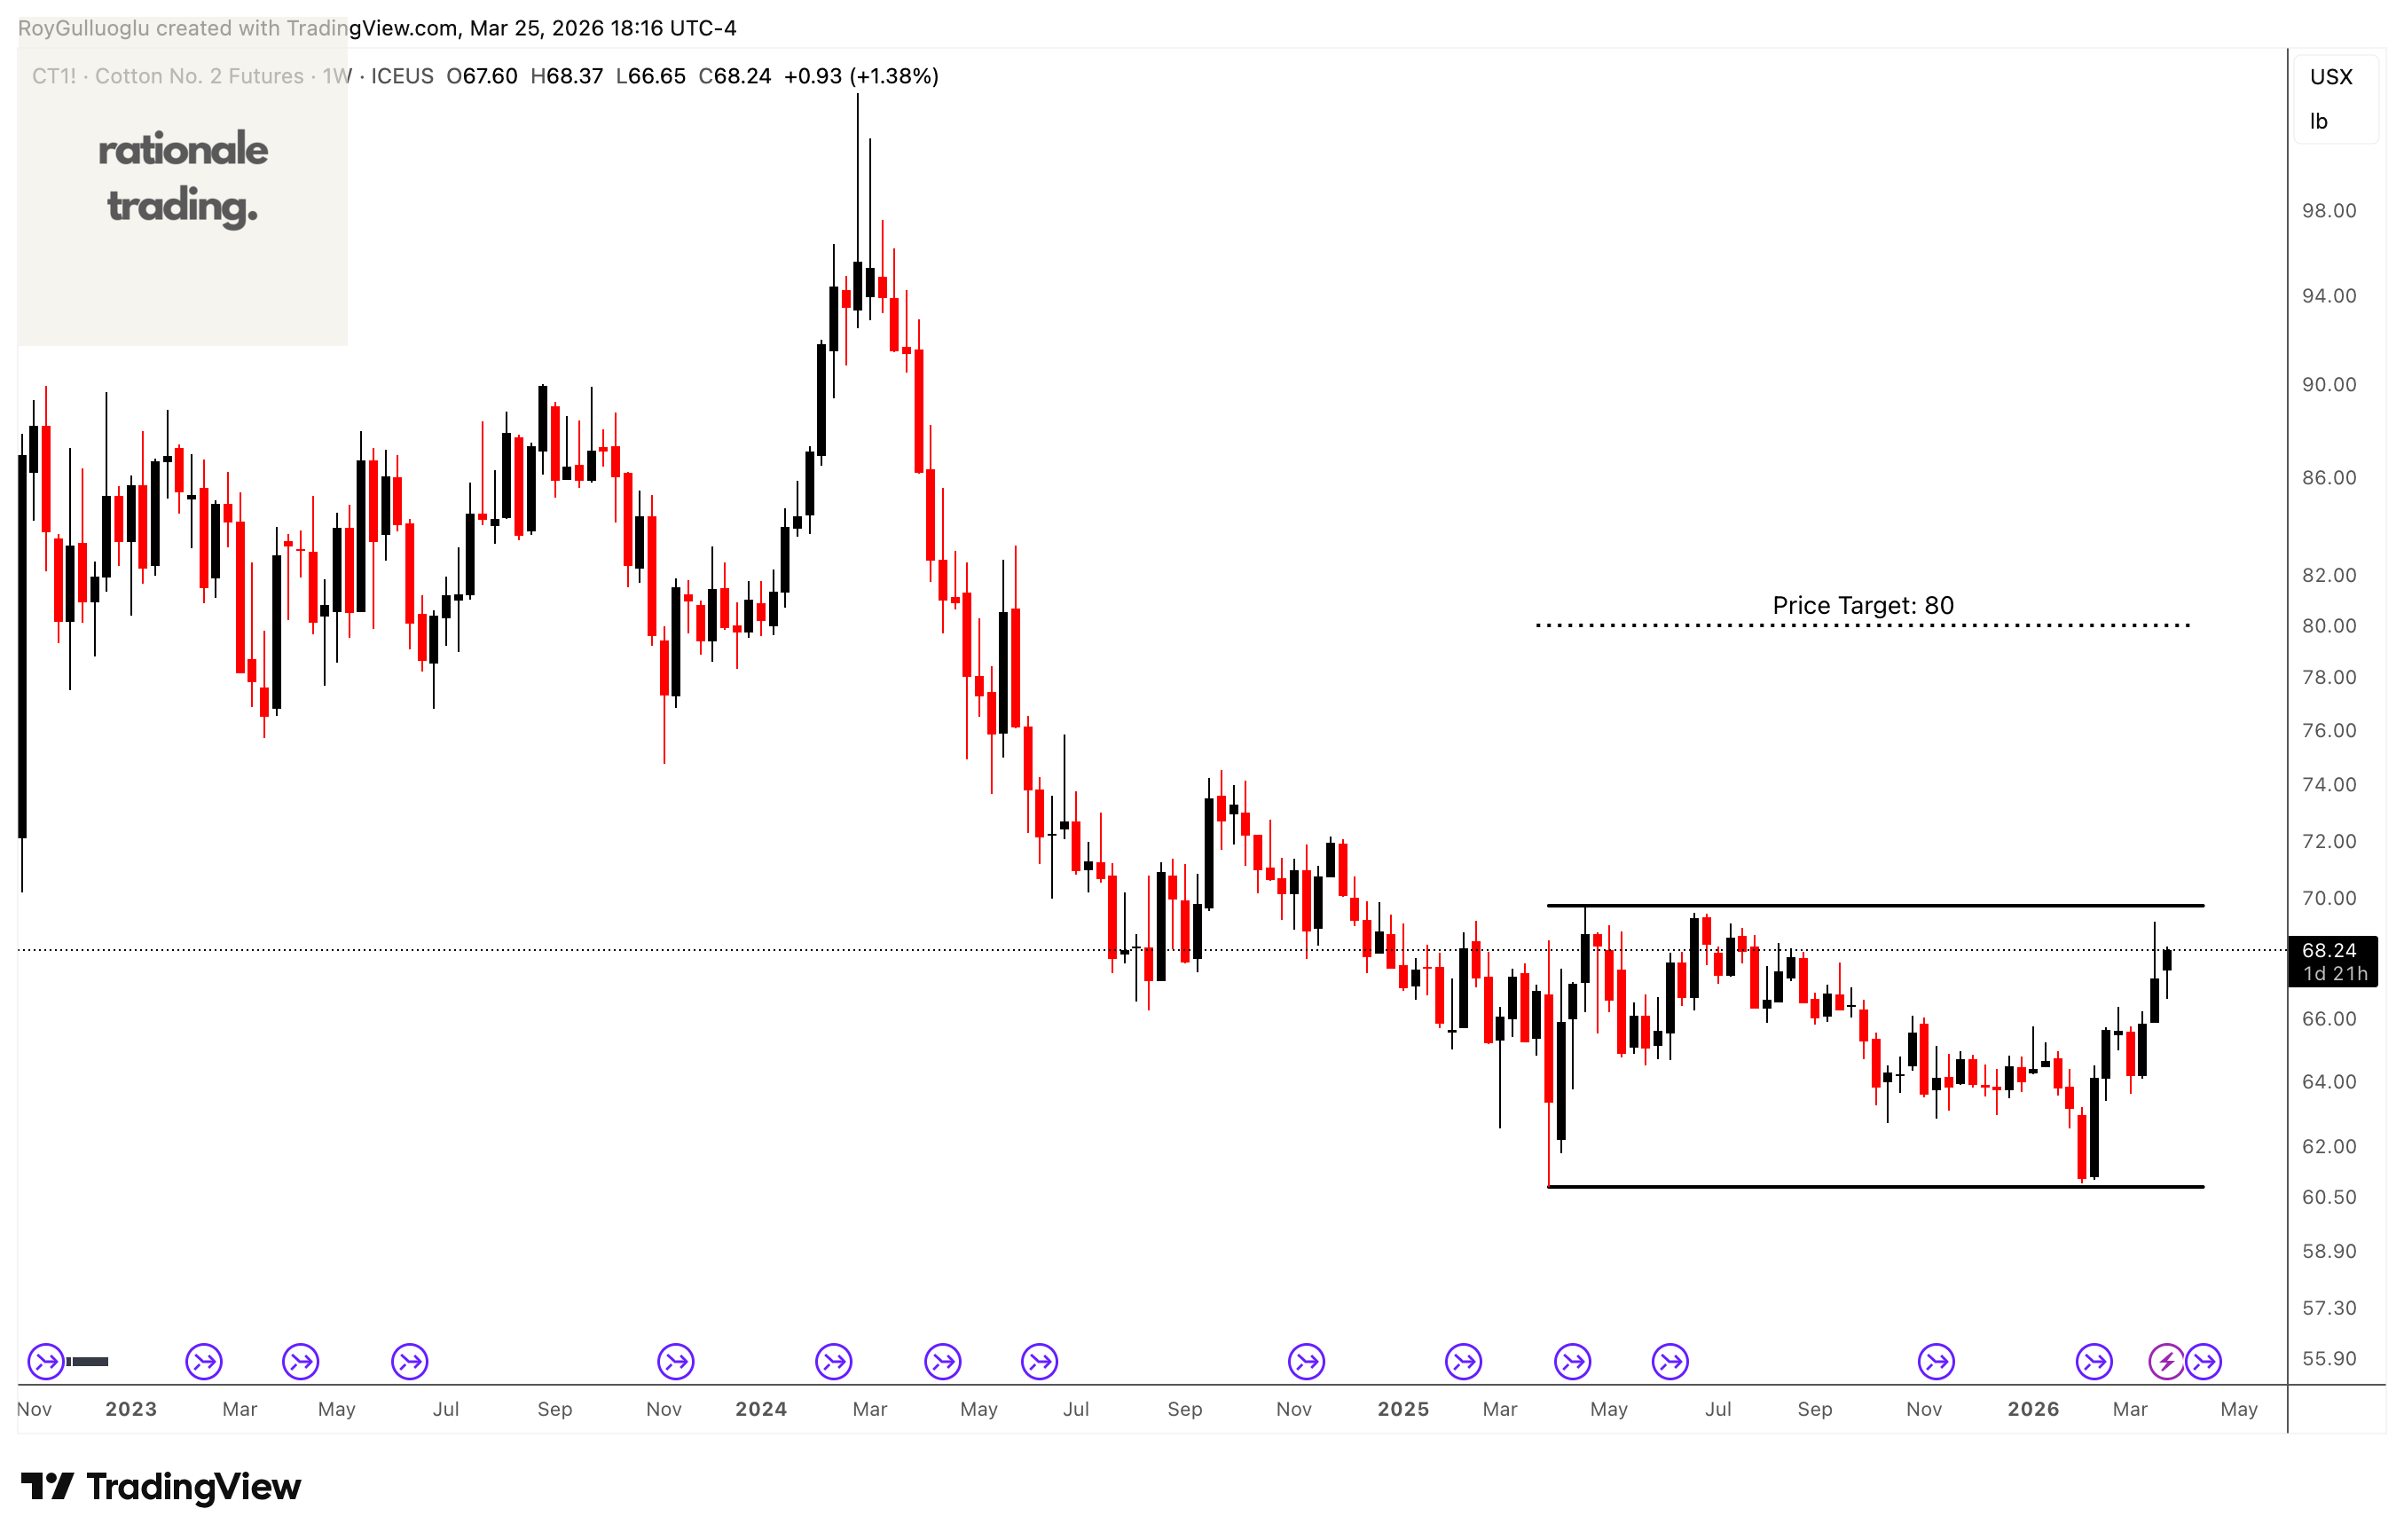
The above weekly chart formed an approximately 13-month-long rectangle chart pattern as a bullish reversal after an downtrend.
The horizontal boundary at 69.75 levels acts as a support within this pattern.
A daily close above 70.5 levels would validate the breakout from the 13-month-long rectangle chart pattern.
Based on this chart pattern, the potential price target is approximately 80 levels.
ZW1!(Wheat Futures)-Long Idea
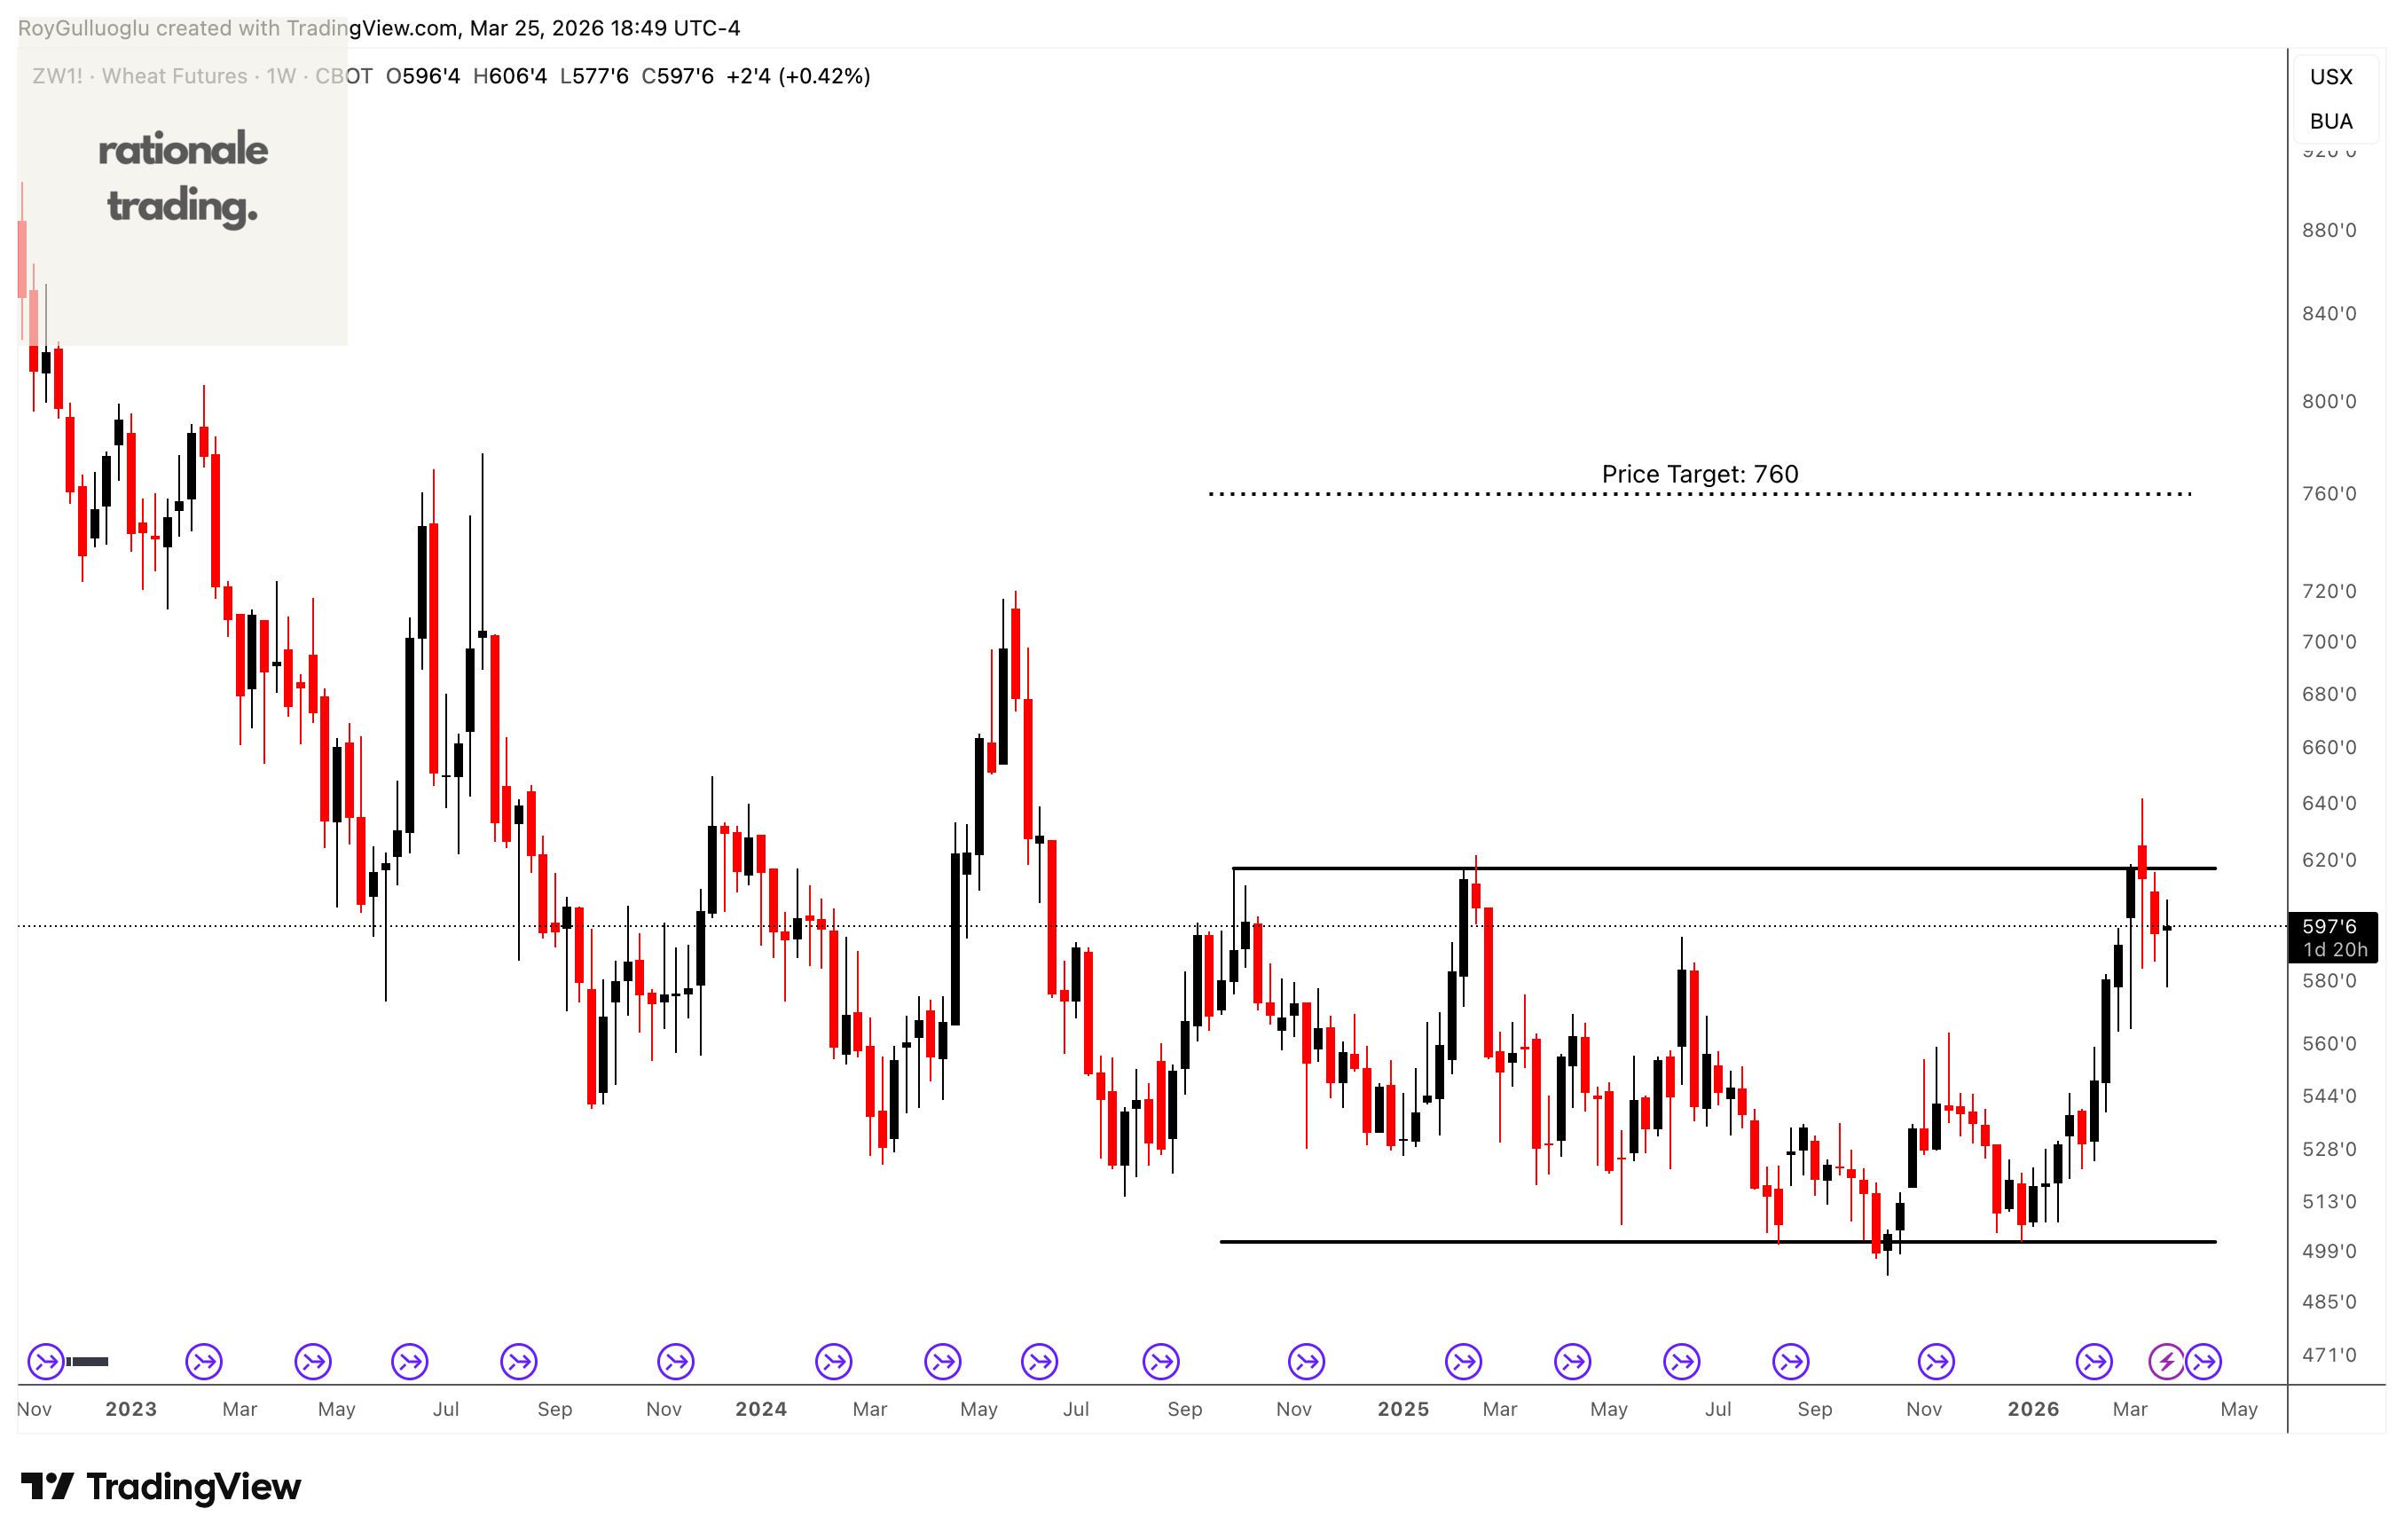
The above weekly chart formed an approximately 19-month-long rectangle chart pattern as a bullish reversal after an downtrend.
The horizontal boundary at 617.2 levels acts as a support within this pattern.
A daily close above 625.4 levels would validate the breakout from the 13-month-long rectangle chart pattern.
Based on this chart pattern, the potential price target is approximately 760 levels.
DXY-Long Idea
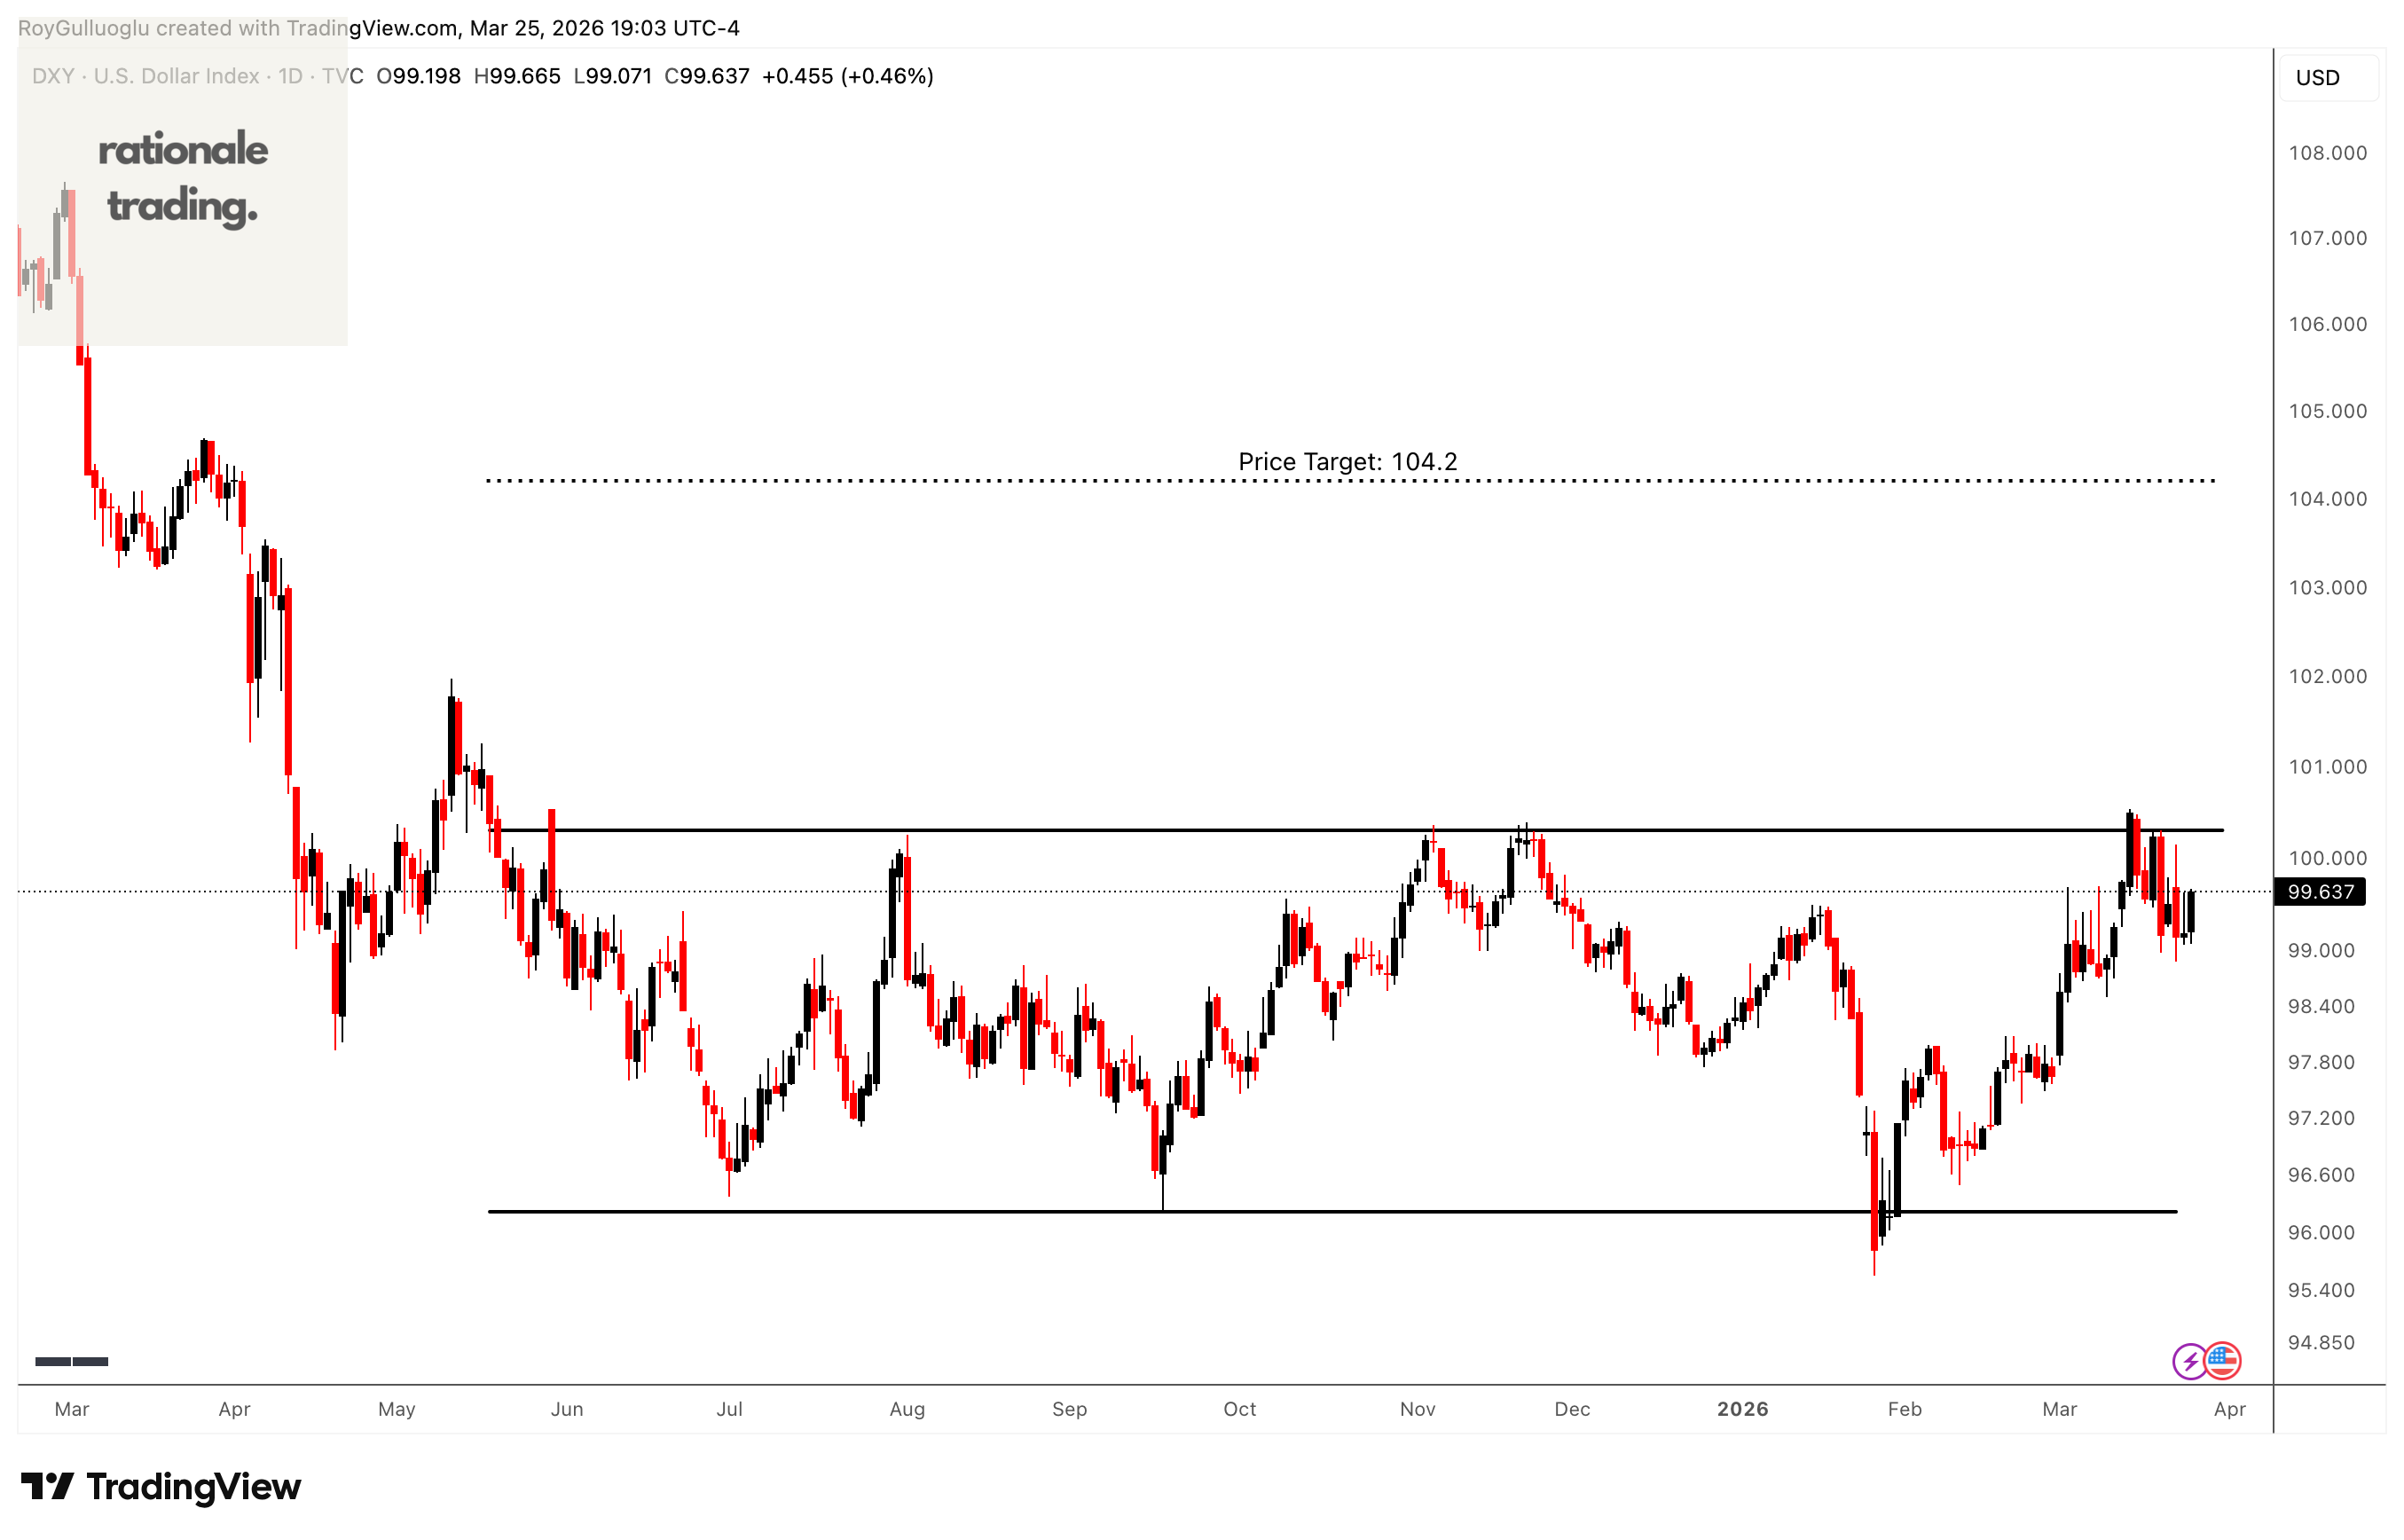
The above daily chart formed an approximately 7-month-long rectangle chart pattern as a bullish reversal after an downtrend.
The horizontal boundary at 100.3 levels acts as a support within this pattern.
A daily close above 100.8 levels would validate the breakout from the 7-month-long rectangle chart pattern.
Based on this chart pattern, the potential price target is approximately 104.2 levels.