

Trade Ideas Fx-Futures-Etf-Crypto
EURGBP, XPDUSD, XPTUSD, ITA(CBOE), UK100

EURGBP-Short Idea
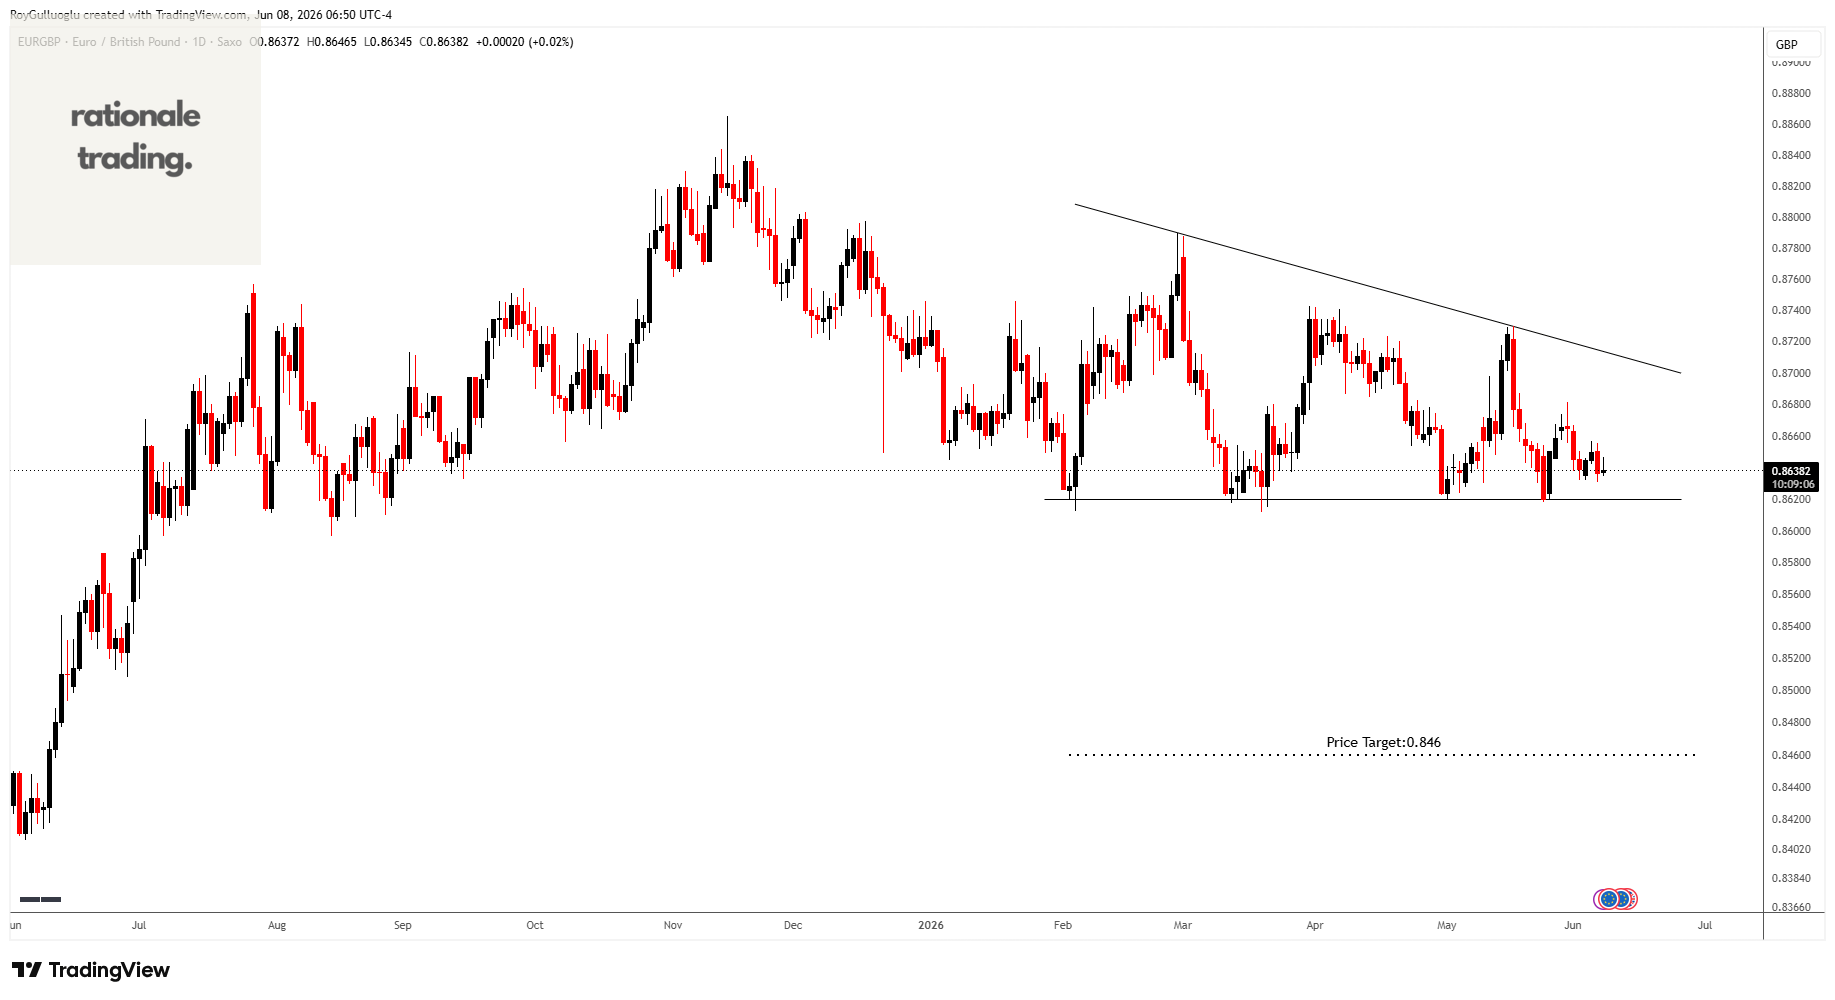
The above daily chart formed an approximately 3-month-long descending triangle chart pattern as a bearish continuation after a downtrend.
The horizontal boundary at 0.862 levels acts as a support within this pattern.
A daily close below 0.86 levels would validate the breakdown from the 3-month-long descending triangle chart pattern.
Based on this chart pattern, the potential price target is approximately 0.846 levels.
XPDUSD-Short Idea
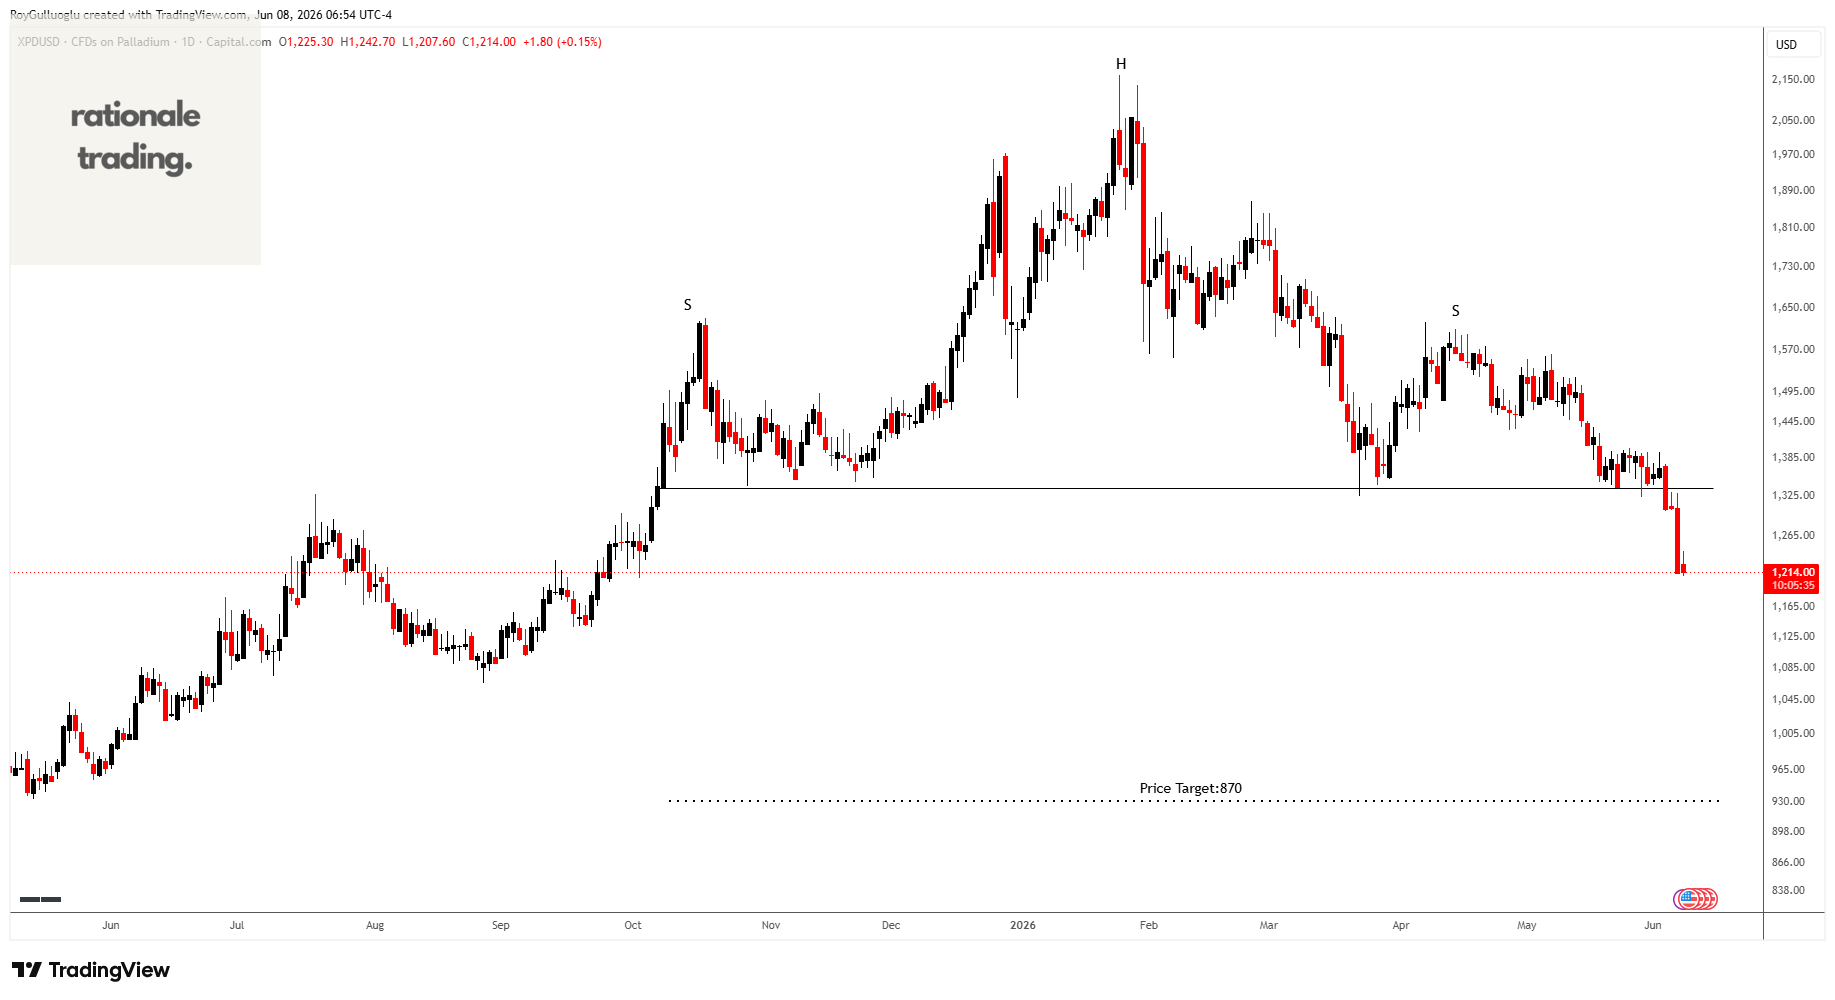
The above daily chart formed an approximately 5-month-long H&S top chart pattern as a bearish reversal after an uptrend.
The horizontal boundary at 1338 levels acted as a support within this pattern.
A daily close below 1300 levels validated the breakdown from the 5-month-long H&S top chart pattern.
Based on this chart pattern, the potential price target is approximately 870 levels.
XPTUSD-Short Idea
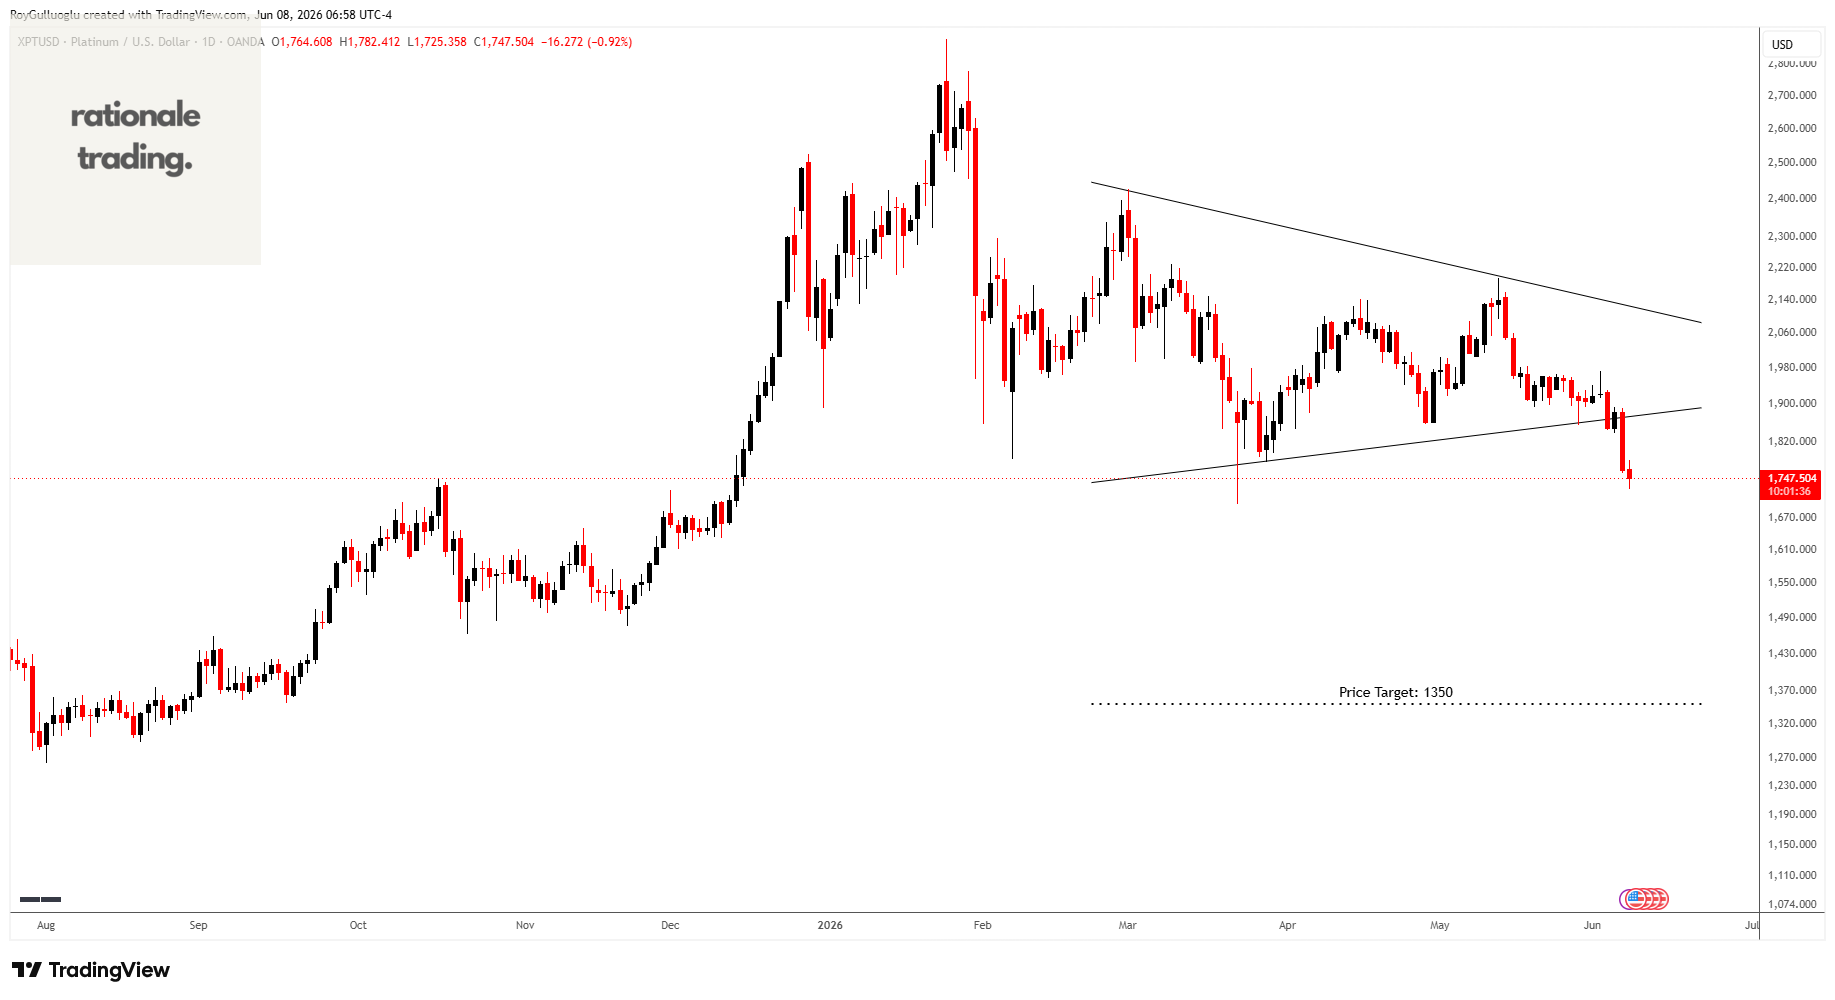
The above daily chart formed an approximately 3-month-long symmetrical triangle chart pattern as a bearish continuation after a downtrend.
A daily close below 1820 levels validated the breakdown from the 3-month-long symmetrical triangle chart pattern.
Based on this chart pattern, the potential price target is approximately 1350 levels.
ITA(iShares U.S. Aerospace & Defense ETF)-Long Idea
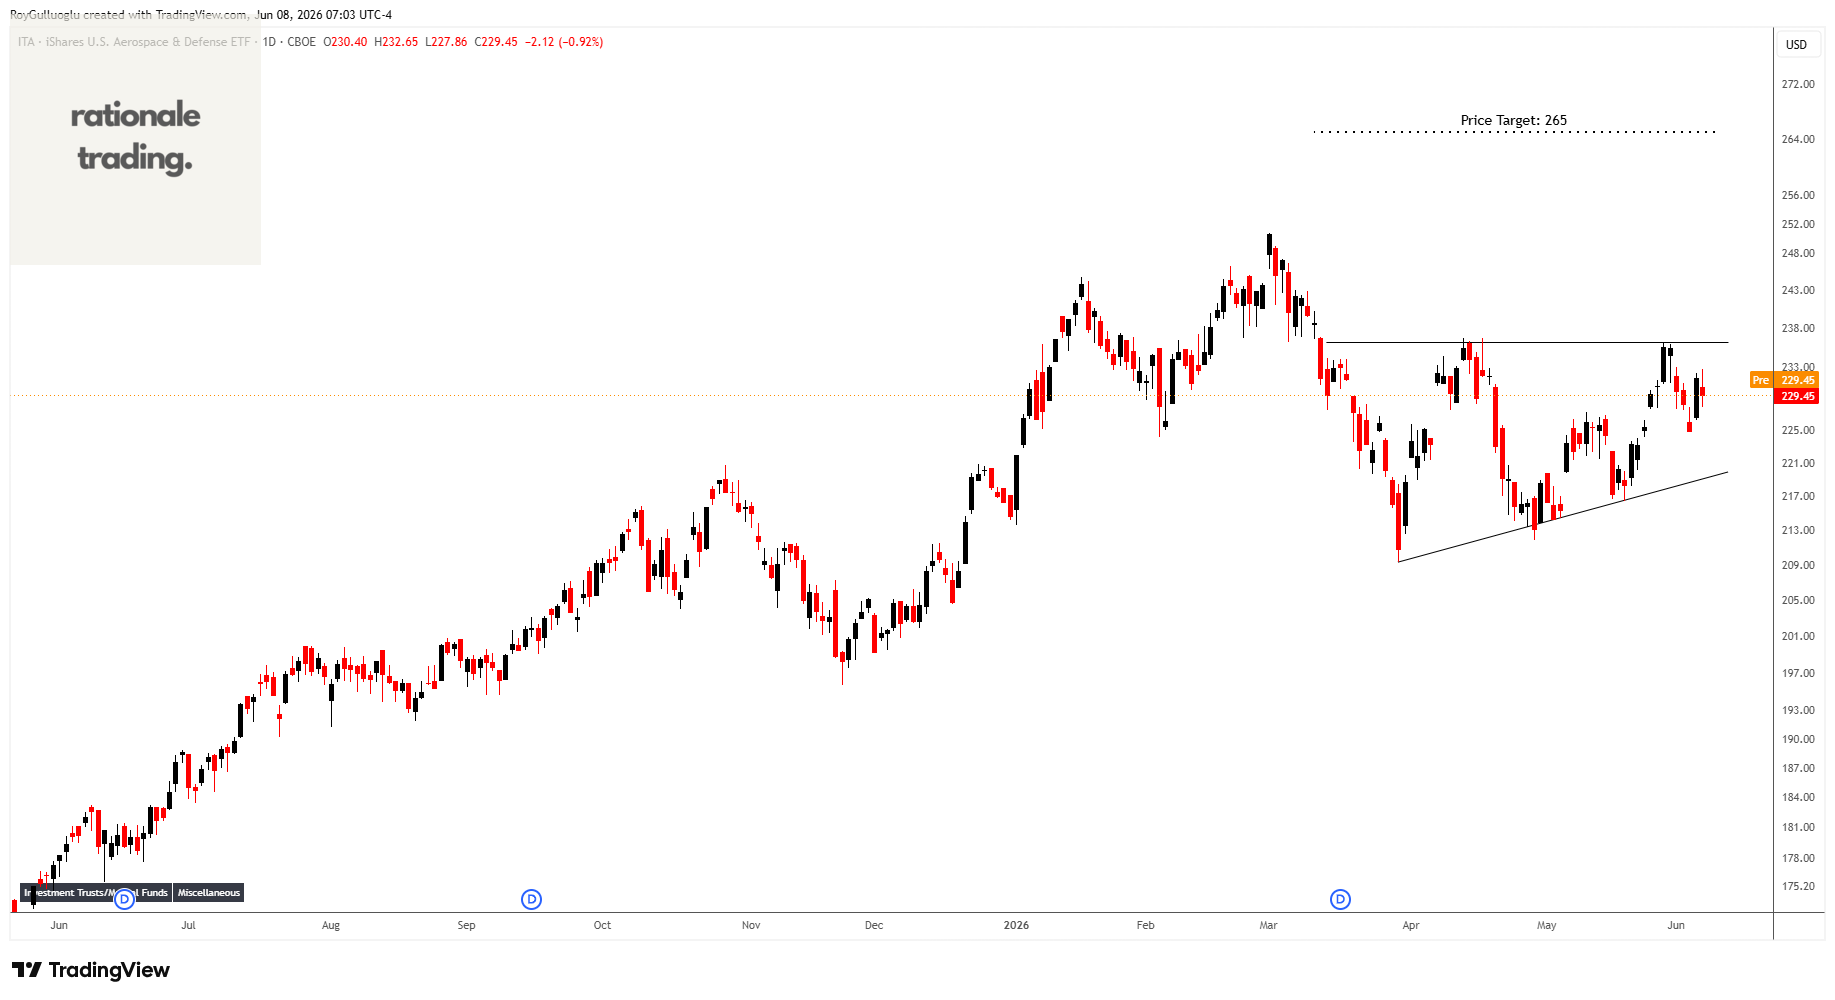
The index measures the performance of the aerospace and defense sector of the U.S. equity market, as defined by SPDJI.
The above daily chart formed an approximately 2-month-long ascending triangle chart pattern as a bullish reversal after a downtrend.
The horizontal boundary at 236.14 levels acts as a resistance within this pattern.
A daily close above 239 levels would validate the breakout from the 3-month-long symmetrical triangle chart pattern.
Based on this chart pattern, the potential price target is approximately 265 levels.
UK100(FTSE100 Index Futures)-Long Idea
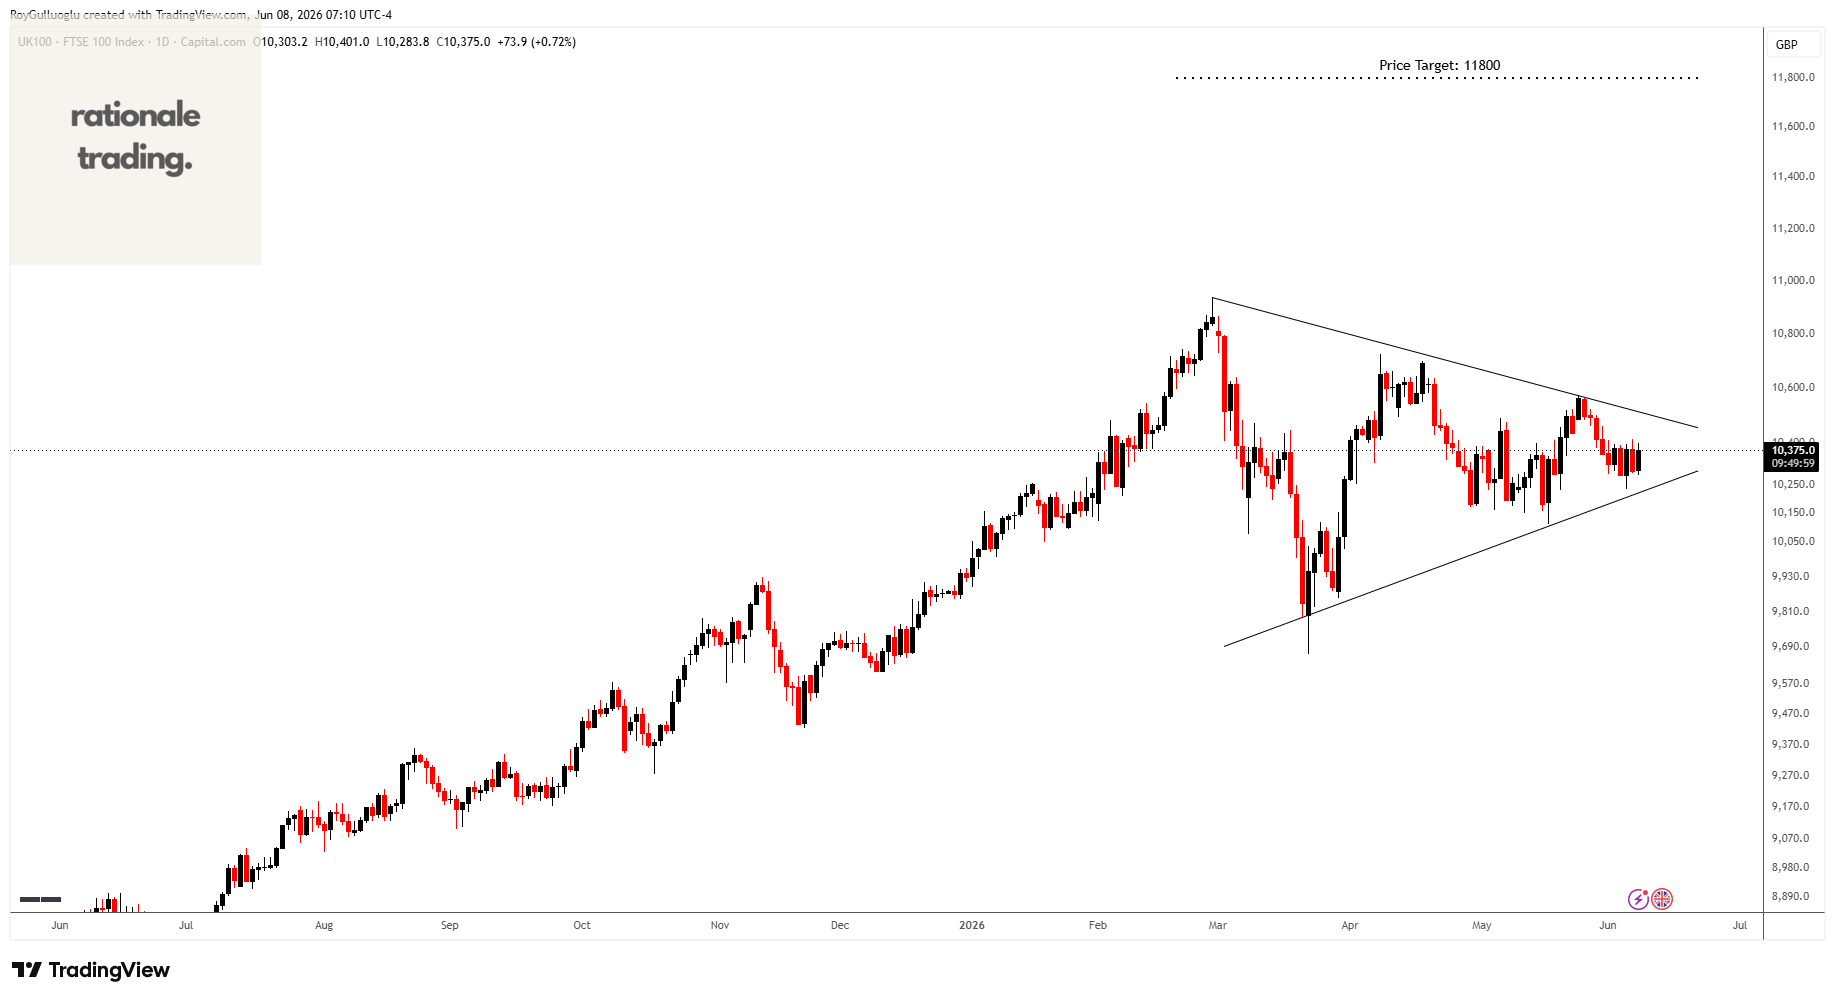
The above daily chart formed an approximately 3-month-long ascending triangle chart pattern as a bullish continuation after an uptrend.
A daily close above 10630 levels would validate the breakout from the 3-month-long symmetrical triangle chart pattern.
Based on this chart pattern, the potential price target is approximately 11800 levels.