About Roy Gulluoglu
Hi, I’m Roy Gulluoglu. I’ve spent several years in the financial markets, focusing on risk management, treasury, and market analysis. My experience in FX, futures, and cryptocurrencies has shaped my understanding of how markets move and how to navigate risk effectively.
Through these experiences, I’ve developed an approach that generates actionable trade ideas and market analysis across various asset classes, emphasizing macroeconomic trends and classical chart patterns.
Rationale is a multi-asset research and strategy service where trading ideas and market analysis are shared. It is designed to help you stay informed about market trends, manage risk, and uncover potential trade opportunities.
What will you find here?
Weekly updates on key market trends and opportunities.
Trade setups across different asset classes based on both technical and macro analysis.
A curated watchlist to keep an eye on developing opportunities.
Whether you’re new to trading or looking to refine your strategies, I’m here to offer insights that can support your decisions.
What are the products of rationale research service?
`TRADE IDEAS EQUITIES` reports
New setups: Potential new candidates based on classical chart pattern formations
`TRADE IDEAS FX-FUTURES-ETF-CRYPTO` reports
New setups: Potential new candidates based on classical chart pattern formations and macroeconomic stance
`TRADE ALERTS` reports
Follow-ups: Updates on trade ideas from previous reports, alerting you when breakout or breakdown levels are approaching.
`WATCHLIST` section
Bear in mind that some trade ideas might be taken out of the reports as they do not act in a certain period. Please be updated about those changes through the watchlist tool where you can find `ongoing` and `not acted yet` classifications.
`MEMOS` from Roy Gulluoglu
What are the key concepts that are frequently used in rationale reports?
CHART PATTERN LENGTHS
Mainly weekly, daily, and 4-hour charts are used in the provided trade ideas.
BREAKOUT/BREAKDOWN CONFIRMATION
In principle, as outlined in the book "Technical Analysis of Stock Trends" - by Edwards and Magee, the breakout confirmation level is determined according to the daily close of 3% away from the boundary for equities as one of the most conservative approaches.
Other breakout/breakdown confirmation tactics that are used:
→ Daily close of 1%/1.5% away from the boundary for FX products
→ ATR(10/30)/2+boundary
FUNDAMENTAL OVERVIEW
The primary focus of research in the rationale reports is technical analysis. There is little emphasis on fundamental factors, yet bolstering a trade idea with fundamental analysis can be advantageous. This is particularly the case when distinguishing between two equities with similar characteristics. It's important to note that an equity with weak fundamentals may still be included in the reports. In such cases, presenting a brief fundamental support point, if available, can support the overall analysis and decision-making process.
CLASSIFICATION OF EQUITIES
Equities` performances may differ according to the different macroeconomic conditions depending on the below classifications. For example, while recession favors small-caps, value stocks may not perform well. Or growth stocks may overperform the value stocks during the times of quantitative easing. Although these rules may not always work, it is worthwhile to consider in the analysis especially favoring one equity over another.
Classification according to the market cap of the equities
How can I utilize the rationale research service as a …?
Fund/portfolio manager or Investor:
Considering these groups` long-duration nature, your go-to charts should be “weekly” or “monthly”. If you check the 02/20/2024 recap of rationale reports 69 trade ideas are in the “ongoing” section which mainly consists of weekly and monthly charts. The 59 of them are above their given entry level. A fund manager who is obliged to hold a certain percentage of their portfolio in equities even in a stagnant market, can benefit from rationale reports.
Regarding portfolio allocation, rationale reports might help fund managers and investors to identify outperformers within specific sector groups by favoring breakouts to the non-movers.
Trader:
Rationale reports aim to present a shortlist of potential candidates aligning with classical chart patterns after scanning 2K+ charts a week. After considering factors like breakout characteristics (specifically volume-related traits), current market conditions (including assessments of risk-on or risk-off sentiment, macroeconomic drivers, etc.), and your overall portfolio risk management strategy (which encompasses aspects like correlated positions), you can implement your trading strategy on the potential candidates identified by the rationale research service.
Whether you’re an experienced trader or just starting out, Rationale provides insights and trade ideas suitable for anyone looking to enhance their market strategies.
How is the performance of the rationale reports evaluated?
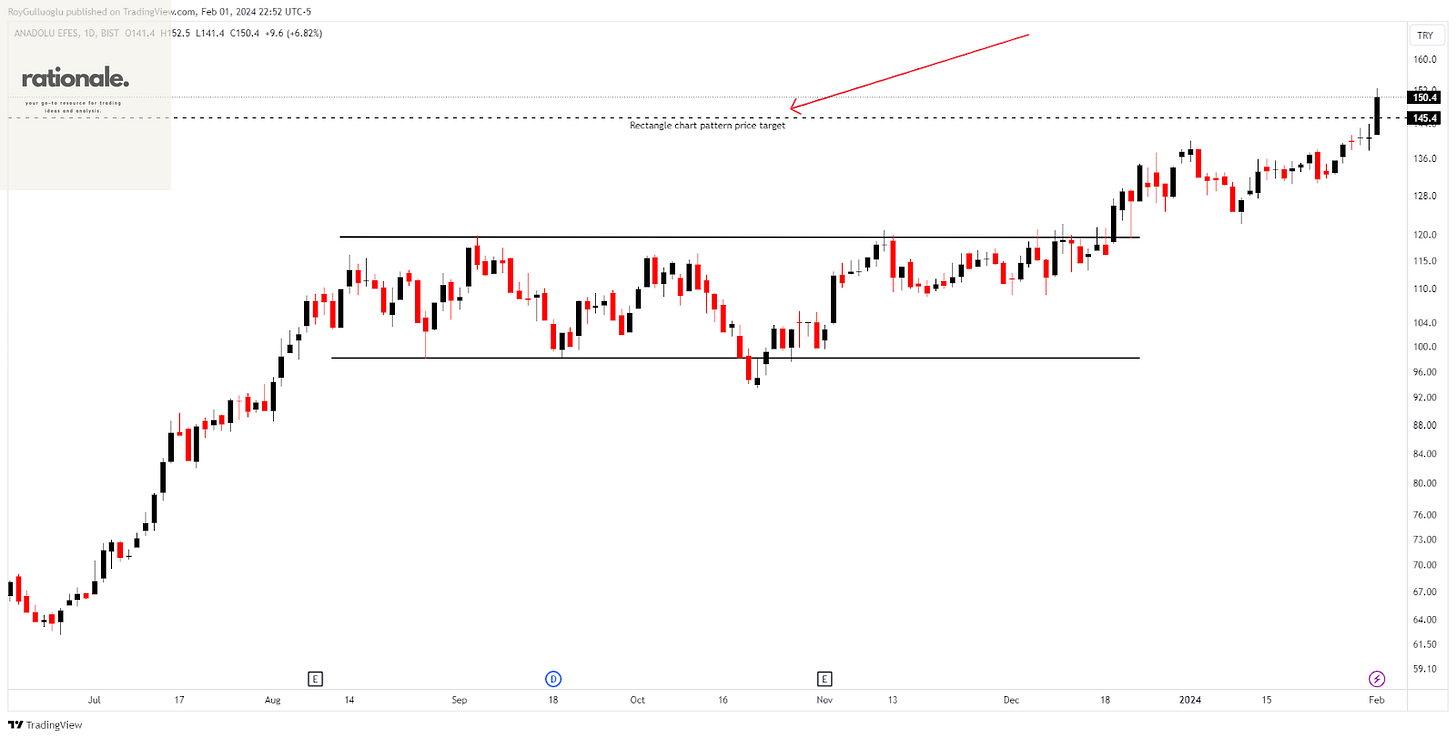
WIN: The financial instruments` price reaches the chart pattern price objective after the breakout or breakdown. The chart pattern price target may not necessarily be utilized as a take profit level.
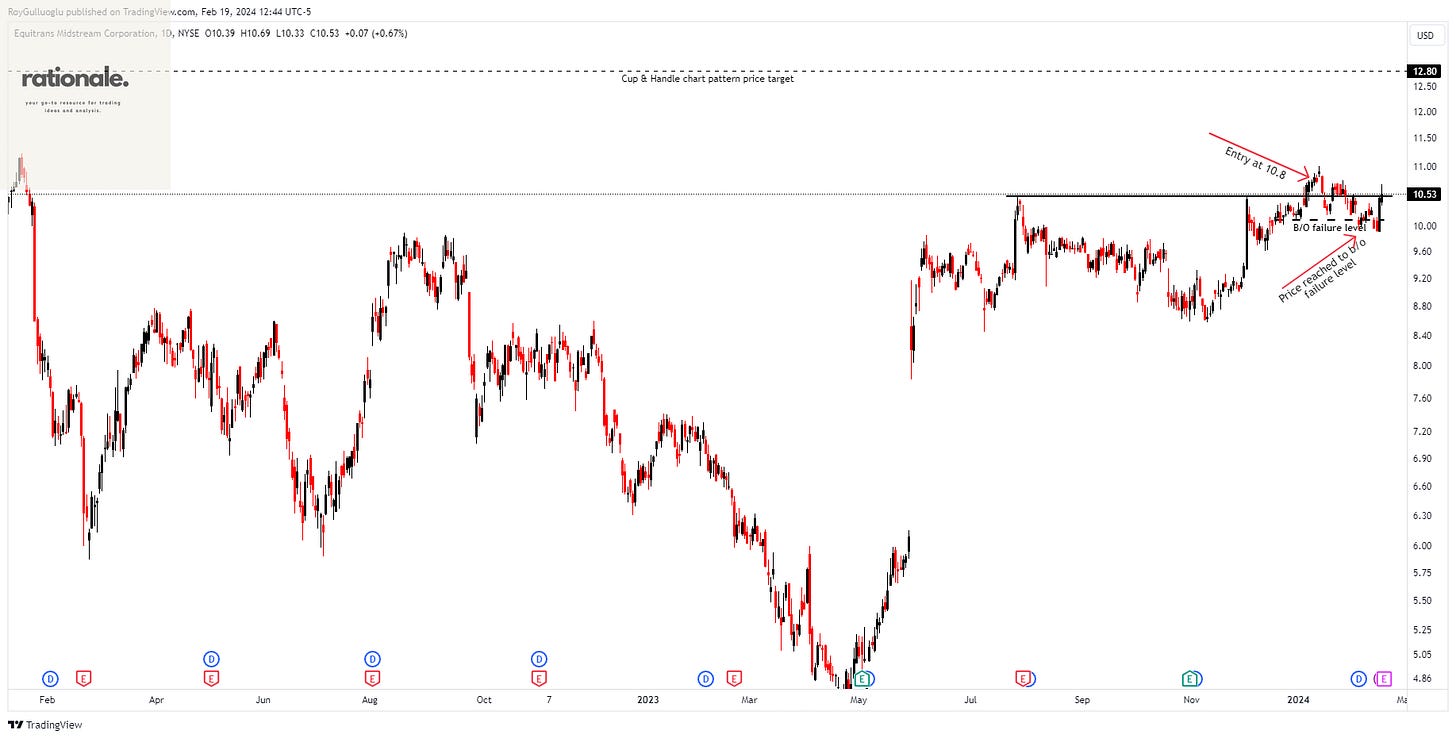
LOSS: The financial instrument’s price goes to the chart pattern negation or breakout failure level after the breakout or breakdown occurs. It is important to note that the breakout failure level should not be perceived as a stop-loss. It is a subjective price level at which the chart pattern is invalidated within the boundaries of the pattern.
ONGOING: The financial instrument is evaluated under the "ongoing" section until it reaches the chart pattern failure level or the price objective level after the price breaks out or breaks down.
NOT ACTED YET: The financial instrument is evaluated under the "not acted yet" section between the time that the trade idea is given and the breakout or breakdown occurs.
If the financial instruments reach the breakout failure level before the breakout or breakdown occurs, they are removed from the evaluation process. Relevant instruments may be included back in the reports with potential new setups.
Please be updated about trade ideas through the watchlist tool as some trade ideas might be taken out of the “not acted yet” list if they do not act in a certain period. Those are also removed from the evaluation process.
How do I subscribe?
It’s easy! Just click the “Subscribe” button below, enter your email, and start receiving the latest updates and trade ideas.
Investment information, comments, and recommendations that are provided are not investment advice. These recommendations are general and are not specifically tailored to your financial situation and risk and return preferences. Therefore, making an investment decision based solely on the information contained herein may not produce results in line with your expectations.


